Abstract
Text complexity is inherently subjective, as it is not solely determined by linguistic properties but also shaped by the reader’s perception. Factors such as prior knowledge, language proficiency, and cognitive abilities influence how individuals assess the difficulty of a text. Existing methods for measuring text complexity commonly rely on quantitative linguistic features and ignore differences in the readers’ backgrounds. In this paper, we evaluate several machine learning models that determine the complexity of texts as perceived by teenagers in high school prior to deciding on their post-secondary pathways. We collected and publicly released a dataset from German schools, where 193 students with diverse demographic backgrounds, school grades, and language abilities annotated a total of 3,954 German sentences. The text corpus is based on official study guides authored by German governmental authorities. In contrast to existing methods of determining text complexity, we build a model that is specialized to behave like the target audience, thereby accounting for the diverse backgrounds of the readers. The annotations indicate that students generally perceived the texts as significantly simpler than suggested by the Flesch-Reading-Ease score. We show that K-Nearest-Neighbors, Multilayer Perceptron, and ensemble models perform well in predicting the subjectively perceived text complexity. Furthermore, SHapley Additive exPlanation (SHAP) values reveal that these perceptions not only differ by the text’s linguistic features but also by the students’ mother tongue, gender, and self-estimation of German language skills. We also implement role-play prompting with ChatGPT and Claude and show that state-of-the-art large language models have difficulties in accurately assessing perceived text complexity from a student’s perspective. This work thereby contributes to the growing field of adjusting text complexity to the needs of the target audience by going beyond quantitative linguistic features. We have made the collected dataset publicly available at https://github.com/boshl/studentannotations.Keywords
1. Introduction
Text complexity, defined as the level of difficulty or intricacy of a text, affects a reader’s overall perception of the content and how the embedded information is processed (Tolochko et al., 2019). If a text is not adjusted to the intended audience, transmitting the relevant information can become largely ineffective (Dahl et al., 2021, Spencer et al., 2019), potentially leading to gaps in knowledge or motivation among the readers (Kleinnijenhuis, 1991, Fulmer et al., 2015). Therefore, transmitting information in a way that is adjusted to the specific needs of the target audience is crucial, particularly in contexts where written texts are used to inform decision-making. Predicting text complexity is a crucial step in determining whether the text could effectively serve its audience.
Early research on text complexity introduced readability measures to assess the complexity of texts, such as the Flesch-Reading-Ease (Flesch, 1948), Gunning-Fog index (Gunning, 1952), and LIX readability score (Anderson, 1983). These measures solely rely on countable lexical or syntactic elements and commonly translate into the years of schooling a reader must have completed to understand the text (see Table 7). These traditional formulas, while useful, often fail to capture the nuanced aspects of text complexity (Jindal and MacDermid, 2017). More advanced tools, such as TextEvaluator (Napolitano et al., 2015) and Coh-Metrix (Graesser et al., 2004), incorporate a wider range of linguistic features, offering a more accurate assessment.
Moreover, recent studies on text complexity develop predictive models to determine text complexity either for single words (Paetzold and Specia, 2016) or for entire sentences (Mosquera, 2022, Naderi et al., 2019). However, they do not account for individual reader characteristics. Thus, an additional line of research trains machine learning models with words, sentences, or larger text excerpts annotated by adults. These models are often fine-tuned transformer-based models, predictive models that require linguistic features or a combination of these approaches (Mohtaj et al., 2022). Yet, due to the multidimensional nature of text complexity (Tolochko et al., 2019) and the specific needs of the audience, existing models to predict the perceived text complexity are scarce and concentrate either on language learners or experts’ domain knowledge (Gooding and Tragut, 2022, Seiffe et al., 2022) but do not take readers’ characteristics into account.
Additional research on text complexity also explores automated text simplification tools aimed at making the embedded information accessible to vulnerable groups such as non-native speakers or those with low literacy levels (Al-Thanyyan and Azmi, 2021, Espinosa-Zaragoza et al., 2023). Similarly, summarization techniques can be used to reduce cognitive load by condensing content into concise, essential statements while preserving the core meaning (Bar-Haim et al., 2020). However, recent work by Shakil et al. (2024) highlights important challenges associated with abstractive summarization, including potential distortions in meaning and a lack of factual consistency. In addition, oversimplified texts can lead to mind wandering because readers become inattentive to the content (Fulmer et al., 2015), which can reduce readers’ motivation and engagement with the text (Yang et al., 2021, Spencer et al., 2019, Tolochko et al., 2019).
Surprisingly, despite the importance of adjusting written texts to the readers’ needs, there is still a considerable gap in understanding how the intended audience actually perceives a text’s complexity. While measuring objective text complexity is essential for providing students with materials suited to their grade level, perceived text complexity captures subjective experiences on an individual level. Assessing perceived text complexity is therefore crucial, as prior research has demonstrated that perception significantly influences both comprehension and reading motivation (Tolochko et al., 2019, Leroy et al., 2010).
In this paper, we thus build a model to predict text complexity as perceived by teenagers prior to major educational choices, accounting for the heterogeneity in student characteristics and abilities. Every year, high school students around the globe receive written materials aimed at guiding their decisions on educational and occupational pathways upon graduating from high school. Thus, teenagers are ideal candidates for this study because materials such as written study guides are specifically designed for them. Yet it remains unclear whether these materials are written in a way that effectively meets the teenagers’ needs. Given the importance of these educational decisions, as they often have a life-long impact, it is crucial to understand how teenagers perceive the text complexity of these materials. A better understanding of their perceptions can help resolve the trade-off between making texts accessible without oversimplifying them, while still providing enough cognitive challenge to engage and stimulate interest. Hence, we train a regression model that can predict how teenagers perceive the complexity of these texts. The model allows for incorporating student heterogeneity in terms of gender, age, language and cognitive abilities, mother tongue, and occupational interests.
Because, to the best of our knowledge, no dataset is already available that incorporates students’ person-related features and their perceptions of a text’s complexity, we self-collected data from 193 high school students in Germany to get a solid data foundation to train the models. Each student completed a short survey and annotated 20 to 100 sentences in different classroom settings. The sentences are extracted from official study guides aimed at informing students on possible post-secondary pathways. As such, these texts are ideally suited for our study because they directly target teenagers and therefore should contain the level of text complexity that teenagers can comprehend. The dataset is described in more detail in section 3 and is available here1.
Because we are interested in incorporating person-related features into the predictions, we evaluate the performance of different machine learning models such as XGBoost (XGB), K-Nearest-Neighbors (KNN), Multilayer Perceptron (MLP), and Support Vector Machines (SVM) in this context. Our results show that KNN, MLP, and ensembles that combine some of these models achieve good results in predicting the perceived text complexity. Furthermore, to get a better understanding of the model’s predictions, we perform a SHapley Additive exPlanation (SHAP) (Lundberg and Lee, 2017) analysis on the best-performing model. The SHAP analysis reveals that the model has learned that students who speak German at home, have higher confidence in their language abilities, or are male tend to perceive German texts as less complex compared to those who do not share these traits. These insights are important because adjusting informational texts comes at a low cost but may help attract underrepresented groups in specific fields of study or occupations.
In addition, we employ large language models (LLMs) to predict text complexity as perceived by students, simulating their perspectives through role-play prompting (Kong et al., 2024). To evaluate the performance of state-of-the-art LLMs, we tested ChatGPT and Claude in annotating sentences from the viewpoint of students with diverse profiles. The LLMs were provided with authentic student profiles and sample annotations to guide their responses, and then tasked with assessing the text complexity of sentences as perceived by the respective student. While the models made attempts to incorporate the provided personal information, a comparison between student-annotated and machine-annotated sentences revealed that ChatGPT and Claude struggled to fully capture the range of demographic and linguistic diversity across students.
This study contributes to different areas of text complexity. First, we show that including person-related features improves the model’s prediction and outperforms baseline models. Our model behaves like the intended audience and can thereby account for the diverse backgrounds of the readers. Second, we let generative LLMs mimic teenagers who rate the complexity of different sentences. Although research has shown that models like ChatGPT can outperform human annotators in some NLP tasks (Gilardi et al., 2023), we find that they are not yet capable of taking into account all aspects of students’ heterogeneity. In this context, the presented method can therefore serve as a tool to improve generative models that provide texts for specific audiences. Third, we show that adjusting text complexity to the reader’s needs goes beyond text simplification: the majority of students rate the sentences as less complex than one would assume based on the sentences’ linguistic features. Still, the results reveal severe differences based on the students’ demographic backgrounds, language, and cognitive skills. Using text simplification tools is unlikely to serve the students’ needs in our context because reading simplified texts may reduce cognitive challenge and lead to a lack of interest (Fulmer et al., 2015). Fourth, we provide a novel dataset based on a large number of student annotators who differ in their individual characteristics. This dataset enables the further development of more individual and profile-based models when it comes to text complexity research.
Overall, the study’s insights are important for educational researchers and policymakers alike: with more first-generation students entering higher education and an increasing number of pathways through educational systems (Marginson, 2016), policymakers and higher education providers must deal with the increased heterogeneity across students. Understanding the needs of the audience may help to improve student counseling and leave no one behind.
2. Related work
Text complexity plays a crucial role in reading comprehension, learning outcomes, and student engagement. Understanding how different levels of text complexity affect students’ ability to process, retain, and engage with texts is essential for both educational research and instructional design. Prior studies have explored the impact of text complexity on student performance, particularly in relation to motivation, comprehension, and cognitive load. Additionally, various approaches have been proposed for assessing text complexity, ranging from traditional readability formulas to modern machine learning-based methods. This section reviews key research on the effects of text complexity on students and discusses different methodologies for assessing text complexity.
2.1. Effects of Text Complexity on Motivation and Comprehension
Prior works have shown that text complexity can significantly affect readers’ comprehension and engagement. Leroy et al. (2010) highlight how increased complexity in health-related texts may hinder understanding, while Tolochko et al. (2019) report similar effects in the context of political communication. Spencer et al. (2019) investigated the learning outcomes of 181 native English-speaking adolescents (aged 9 to 15 years) when exposed to texts of varying complexity. Their findings indicate that increased text complexity can hinder learning outcomes, particularly in recalling and summarizing textual details, underscoring the need for appropriately leveled texts. However, oversimplified texts may fail to sustain students’ interest, resulting in lower engagement. Fulmer et al. (2015) argue that students are more engaged when texts are both stimulating and appropriately challenging. When a text lacks depth due to oversimplification, students may lose motivation to read. Similarly, Yang et al. (2021) explored the effects of text difficulty in extensive reading on the comprehension of the text and the motivation of learning English as a foreign language among high school students in Taiwan. Participants read texts that were either slightly easier or slightly more challenging than their current proficiency level, while a control group followed the standard curriculum. The study found that students reading easier texts demonstrated greater improvements in overall and literal comprehension, whereas those reading more challenging texts showed higher reading motivation and self-efficacy. Overall, existing research on the effects of text complexity on motivation and comprehension underscores the importance of balancing text complexity to enhance both. Simpler texts can improve retention and engagement but may reduce cognitive challenge, whereas more complex texts can stimulate interest but may hinder accessibility. This trade-off calls for adaptive text difficulty that accommodates individual student needs, ensuring effective learning and sustained motivation.
2.2. Text Complexity Assessment
Developing formulas to measure text complexity has a long tradition, resulting in several established methods for evaluating text difficulty, such as the Gunning-Fog Index (Gunning, 1952) and the LIX readability score (Anderson, 1983). A popular and still widely used measure to determine the readability of a text is the Flesch-Reading-Ease (FRE), developed for the English language by Flesch (1948) and adjusted to the German language by Amstad (1978). The FRE score maps the years of schooling a reader must have completed to understand the text (see Table 7). It ranges from 0 to 100, where higher scores refer to less complex texts.
Traditional readability formulas, such as the Flesch-Reading-Ease, rely on simplistic metrics like sentence length and word frequency, which often fail to capture the nuanced aspects of text complexity. In contrast, more advanced computational tools such as TextEvaluator (Napolitano et al., 2015) and Coh-Metrix (Graesser et al., 2004) integrate a broader range of linguistic features into the calculation of a readability score. The incorporation of syntactic structures, lexical difficulty, and textual cohesion provides a more comprehensive and accurate assessment of readability.
Due to advances in machine learning and natural language processing, more recent research focuses on developing predictive models to determine text complexity. These predictions can be made for single words (Paetzold and Specia, 2016) or for entire sentences (Naderi et al., 2019, Mosquera, 2022). On the level of words, the SemEval task for complex word identification (Paetzold and Specia, 2016), in which non-native English speakers were asked to annotate whether or not they could understand the meaning of a specific word in a sentence, was launched in 2016 to train a model that is able to predict complex words in a binary fashion. On the level of sentences, the Text Complexity DE Challenge 2022 (TCDE) (Naderi et al., 2019) aimed to build regression models that could predict text complexity solely on linguistic features. For both shared tasks, the SemEval and TCDE challenges, non-native speakers were asked to evaluate the words’ and sentences’ complexity.
Identifying complex words and sentences in a given text is often related to text simplification, i.e.,
replacing complex words with alternatives that are easier to understand for non-native speakers.
Existing research on text simplification thus mostly concentrates on language learners and has provided
a large set of tools that allow for reducing a text’s complexity without reducing its informational
content (Al-Thanyyan and Azmi, 2021, Espinosa-Zaragoza et al., 2023).
Similarly, automatic classification tools make it possible to classify texts depending on their
complexity. For instance, Santucci et al. (2020) provide an algorithm that
classifies the readability of Italian texts written for language learners according to six different
categories.
In recent years, in-context learning (ICL) has emerged as an effective method for solving a wide range
of NLP tasks. In this approach, large language models are prompted with a few labeled examples at
inference time, allowing them to perform tasks without any additional training (Brown
et al., 2020). Subsequent work has shown that the effectiveness of ICL can depend
on several factors, including the quality, order, and format of the provided examples (Min
et al., 2022). In the domain of text readability, Lee and Lee (2023) adapt this approach by
using prompt-based models to compare sentence pairs in terms of difficulty. Their results suggest that
with carefully constructed prompts, in-context learning provides a viable method for assessing text
complexity.
2.3. Reader-centered Approaches to Text Complexity
Understanding text complexity requires considering how different audiences perceive a text’s difficulty, as individual characteristics such as age or language proficiency affect the readers’ comprehension and engagement. Thus, understanding text complexity goes beyond text simplification or classification for language learners. For instance, individuals with cognitive impairments or low literacy levels may require simplified sentence structures to effectively process the relevant information. Thus, individual characteristics may play a role in how readers evaluate a text’s complexity. To date, only a few studies take into account individual characteristics of the readers or annotators. Gooding and Tragut (2022) provide a complex word identification task on a more individual level. Using an active learning framework, the authors create personalized models for the annotators and show that these models outperform baseline and state-of-the-art systems in predicting word complexity. On the level of sentences, Seiffe et al. (2022) use annotated German sentences from an IT Service Provider about their products and ask experts and non-experts to evaluate the complexity of these sentences. Despite better domain knowledge, experts tend to rate sentences as more complex than non-experts. This highlights how individual biases can shape subjective complexity assessments, as perception does not always align with objective difficulty (Dunlosky and Metcalfe, 2008).
One approach to gain insights into students’ perception of text complexity is simulating student responses using large language models (LLMs). Previous research has explored student simulation in the context of both teaching plans and exam questions. Hu et al. (2025) investigate the potential of LLMs to assist teachers by simulating teacher-student interactions, refining teaching plans, and generating reflections on teaching processes. Similarly, Benedetto et al. (2024) show that LLMs can simulate students of varying skill levels by answering exam questions across different educational domains. However, they also highlight that prompts engineered for specific models, such as GPT-3.5, do not generalize well to other LLMs, emphasizing the need for model-specific prompt engineering. Research on student simulation thus suggests that while LLMs can be valuable tools for simulating student responses, their effectiveness heavily depends on well-designed prompt engineering. Furthermore, insights into students’ perceived text complexity can be beneficial, as they enable the development of user-centric applications such as personalized writing assistants (Lee et al., 2024) that can help students improve their writing and comprehension skills.
Overall, existing research on text complexity as perceived by the intended audience is scarce. Understanding how readers perceive a text is, however, of particular importance to transmit the embedded information efficiently. This is in line with psychological research that suggests that a low level of text complexity may lead to inattention during reading because mind wandering can increase (Fulmer et al., 2015). While a large number of models exist that solely use linguistic features to predict a text’s readability, there is a considerable gap in understanding how the intended audience actually perceives a text’s complexity.
3. Data Collection and Feature Development
Developing and training a model for text complexity requires data on various factors, including the perception of text complexity, individual characteristics such as native language and overall linguistic abilities, as well as information on the readers’ active vocabulary. These features are explained in more detail below.
3.1. Perception of Text Complexity
Data on teenagers’ perceived text complexity was collected at five occasions in classroom settings at the end of a lecture on the opportunities and challenges of generative AI in education. The lecture excluded any association with text complexity to avoid any bias arising from anchoring effects (Tversky and Kahneman, 1974). At the end of the lecture, all teenagers accessed a randomly assigned annotation set by connecting to an online tool with their cell phones (see Appendix B.1). The origin of the data and the survey design are explained in more detail in the following.
3.1.1. Compilation of Text Corpus
The text corpus is based on two different datasets that comprise informational texts. The first dataset contains sentences from student guides on “Study and Career Choice” published by the German Federal Employment Agency to assist high school students during the transition from high school to college or the labor market (Bock, 1974, Hertweck et al., 2024). Since 1971, these annually updated books have been distributed to high school students in the year leading up to high school graduation and are considered official study guides for Germany. Each book comprises up to 800 pages describing the variety of educational and occupational pathways, detailed information on all fields of study, as well as additional information on student life, such as student housing and financial aid. Because these books are written for teenagers aged 16 to 19 years old to assist them in their post-secondary school choices, they have a very clear intended audience.
We digitized all guides from 1971 to 2021 and extracted all texts on fields of study and related occupations using PDFAct (Bast and Korzen, 2017). In a subsequent step, texts were automatically checked for punctuation and grammar rules using language tool python2. For each sentence, the FRE score for the German language was calculated using the Python library textstat3. Afterwards, the sentences were grouped into five categories ranging from least complex (FRE score of 100 to 80) to highly complex sentences (FRE score of 0 to 20). To create a mostly balanced dataset, sentences were randomly selected from each of the five categories, aiming to include an equal number of sentences per category.
The second dataset consists of sentences from the Text Complexity DE Challenge 2022 (TCDE). The TCDE corpus contains sentences from German Wikipedia articles of various genres that were rated according to their complexity by non-native speakers. By combining these two text corpora, we can combine sentences that have been exclusively written for teenagers as well as sentences in the German language that have already been annotated by a large set of readers.
In compiling the text corpus for our study, we randomly select sentences from both datasets to be annotated by teenagers in classroom settings. The resulting text corpus consists of 1697 unique sentences, of which 1143 sentences are from the study guides (exclusively written for teenagers) and 554 sentences from Wikipedia articles based on the TCDE challenge (written for the general population).
3.1.2. Data Collection
To collect data on students and their perceptions of the complexity of different sentences, an online tool was used. The tool was kept simple (see Appendix B.1) and presented questions in a survey-style manner. At the beginning, students were asked to consent to the use of their data for research purposes. Afterwards, the survey started with eight questions on the students’ demographic characteristics (age, gender), information on their language skills (language spoken at home, self-stated German skills), their plans after high school (type of education, field), and their school grades in German and Maths. Finally, the students were asked to rate the complexity of twenty sentences on a 5-point Likert scale, one sentence at a time. More precisely, students were asked: In the following, individual sentences will be displayed to you. Please read through the sentences and indicate how well you understand each sentence. The response options range from 1 (‘very easy to understand’) to 5 (‘very difficult to understand’).
The number of sentences per student was purposely kept low, with only twenty sentences to be read and rated, to avoid frequent challenges encountered in repetitive tasks such as participants’ learning and a decline in their attention as the tasks progress (Kahneman, 1973). Still, a few students stopped rating before the end of the survey. Five student volunteers were additionally asked to complete more than a single survey of previously annotated sentences to obtain a high number of sentences with multiple annotations.
3.1.3. Resulting Dataset and Evaluation
After having completed data collection with a total of 193 students, each rating twenty out of the 1697 unique sentences, the dataset for the model was compiled. All annotations from students below the age of 16 and those who did not consent to the use of their data had to be removed to comply with data protection regulations. We extend the previously published dataset from our earlier study (Thome et al., 2024): the final dataset comprises 3954 annotated sentences, consisting of 794 sentences from the TextComplexityDE challenge as well as 3160 sentences from the study guides. The combination allows for the inclusion of generic sentences for which an assessment of their readability has already been available, as well as sentences that have been written specifically for teenagers to inform them about future study and career opportunities.
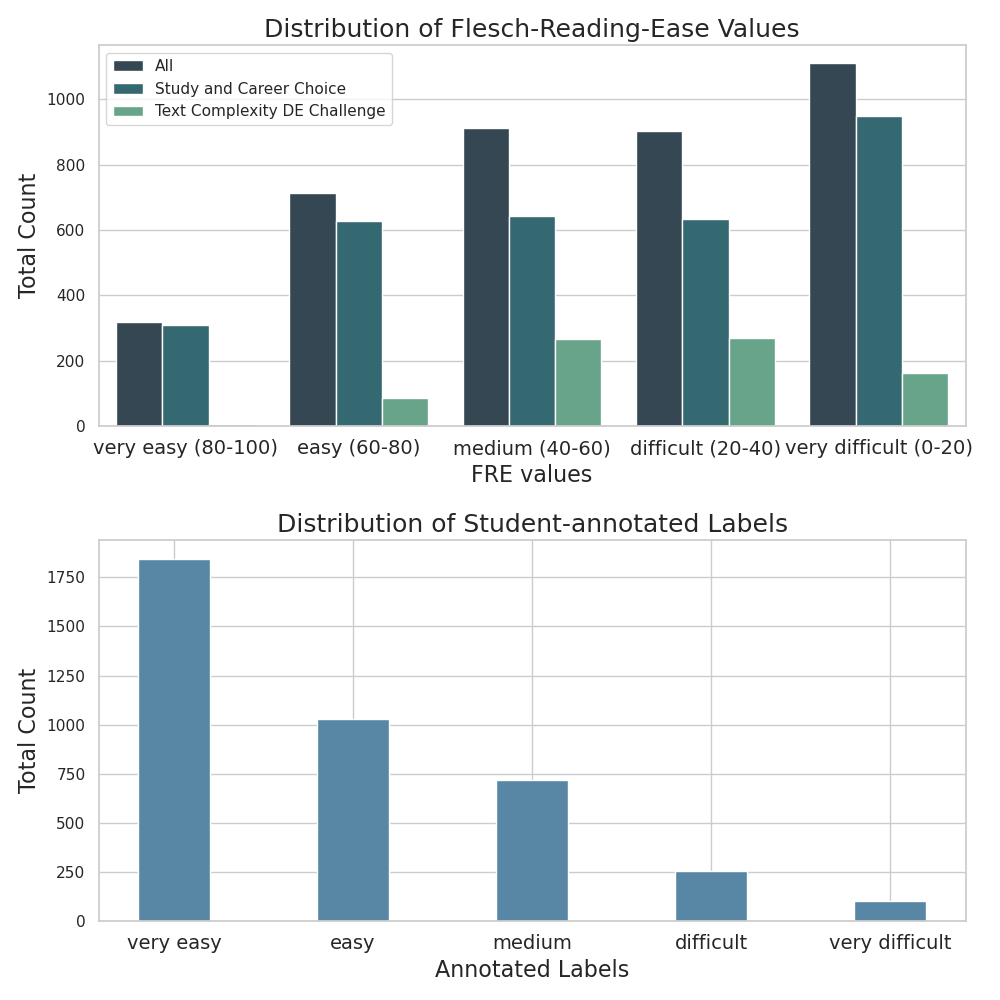
Figure 1 illustrates the distribution of FRE scores of the sentences in comparison to the students’ actual annotations. To match the labels of our survey, we defined FRE value ranges in increments of 20 that reach from very easy to very difficult. The figure shows that the majority of sentences are more complex (indicated by a lower FRE score) than what would be suitable for high school students (FRE score of 60 to 80). When comparing the FRE distribution to the student-assigned ratings, we notice an opposite distribution with a high level of imbalance (see Figure 1): the students rated 46.7% of the sentences as very easy, 26.1% as easy, 18.1% as medium, 6.5% as difficult, and 2.6% as very difficult. The distribution of complexity ratings is heavily skewed towards the easier end of the spectrum. A significant majority of the students (72.8%) labelled the sentences as very easy to easy, indicating that most students perceive the sentences to be of low difficulty – despite their occasionally high linguistic complexity as indicated by the low FRE scores.
On average, each of the 1697 unique sentences of the text corpus was labelled by 2.33 students. We calculate Krippendorff’s \(\alpha \) for ordinal data using the Python library krippendorff 4 to measure the inter-annotator agreement (IAA) between the students. The annotations achieve an IAA score of 0.23. We attribute the low IAA score to the high amount of heterogeneity in the annotators’ personal characteristics. Beyond the potential inaccuracy of average predictions based on this data, this highlights the necessity for a more individualized model.
3.2. Individual Characteristics
To provide deeper insights into the distribution of person-related features, Table 1 presents a detailed overview. A total of 193 high school students contributed to the sentence annotations, with 92 students (47.67%) identifying as female and 91 students (47.15%) as male. The remaining 10 students (5.18%) either stated to be non-binary or chose not to disclose their gender. In terms of the language spoken at home, 52.85% of the students state that they only speak German at home, while 14.51% of the students do not speak any German at home. The remaining 32.62% of the students speak both German and another language at home. Moreover, the data reveal that the majority of students achieve grades in the ‘good’ (2) and ‘satisfactory’ (3) range in Maths and German, indicating a solid understanding in both subjects. However, a notable proportion of students tend to score lower in Maths than in German.
3.3. Out-of-vocabulary Words
Students may rate a sentence as complex for various reasons, such as intricate sentence structure or the presence of unfamiliar words. The exposure to the out-of-vocabulary words affects cognitive processing and comprehension. We approximate the out-of-vocabulary words by combining the students’ grade in German with an existing text corpus, the GraphVar corpus (Romstadt et al., 2024), on essays written by teenagers in Germany.
3.3.1. GraphVar Corpus
The GraphVar corpus (Romstadt et al., 2024) is a compilation of more than 1600 high school essays written between 1917 and 2018 at a high school in Germany as part of the final exams in the subjects History, Biology, and German. It is mainly used to describe the graphemic variation and its development over time.
3.3.2. Feature Development
We use the GraphVar corpus to extract a vocabulary that approximates the lexical understanding of the students in order to use it as an input feature for the text complexity model. Thus, we only use essays from German exams, ensuring the data closely aligns with the students who completed the survey. Based on the grades of the German essays from the GraphVar corpus, we then create three different sets of vocabularies. These vocabularies approximate the words that students from the survey are likely to understand and recognize, which is commonly referred to as passive vocabulary.
| German grade | Vocabulary | Size |
|---|---|---|
| 1 (very good) |
\(V_3\) |
36,531 |
| 2 (good) | ||
| 3 (satisfactory) |
\(V_2\) |
36,324 |
| 4 (sufficient) | ||
| 5 (poor) |
\(V_1\) |
31,600 |
| no answer |
To create the three sets, we first subdivide the points of the grading systems into three categories: \(V_1\): satisfactory and below (grades 5 to 3), \(V_2\): good and below (grades 5 to 2), and \(V_3\): very good and below (grades 5 to 1). By defining our vocabularies as nested subsets \(V_1 \subset V_2 \subset V_3\), we assume that students with better German grades have a larger vocabulary. Table 2 shows the assignment of the vocabularies to the students in our self-collected dataset based on their German grades. To account for the fact that the passive vocabulary is larger than the active vocabulary, i.e., the set of words a student actively uses, we assign each student a slightly better vocabulary. All words from the respective vocabularies are lemmatized. In the final step, we calculate the proportion of words in each sentence that a student with a given level of German skills, as indicated by their German grade, might not be familiar with. We define the out-of-vocabulary ratio (OOV) for each annotated sentence as
\(OOV=\dfrac {N_\text {unfamiliar}}{N_\text {total}}\)
with \(N_\text {unfamiliar}\) being the number of unfamiliar words in the sentence and \(N_\text {total}\) being the total number of words in the sentence. Using a relative measure instead of the absolute count of unfamiliar words per sentence gives more weight to unfamiliar words in shorter sentences than in longer ones. This is an important aspect because students may be able to infer the meaning of an unfamiliar word from its context.
4. Methodology
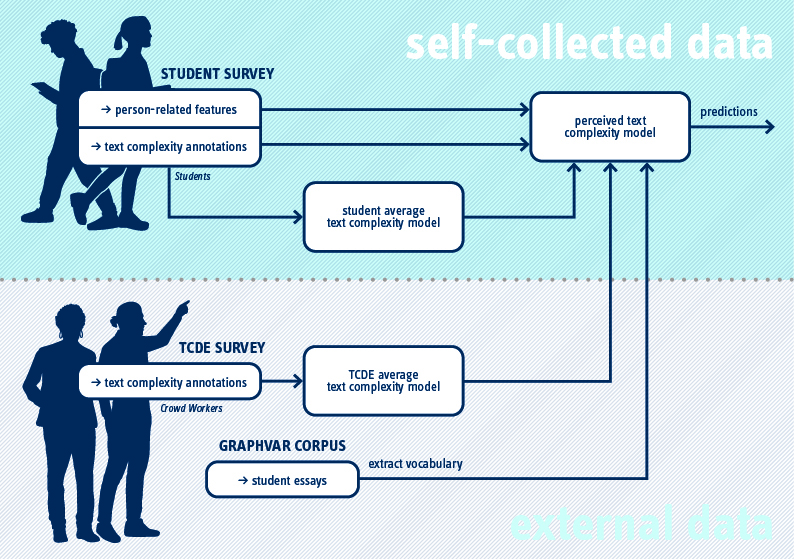
In the following, we describe how we train several machine learning models to perform text complexity predictions based on person-related and linguistic features. The entire model is illustrated in Figure 2.
4.1. Average Text Complexity Prediction
This subsection focuses on the assessment of average text complexity scores. Our aim is to predict average text complexity values that serve as a baseline and can be used as an input feature for the perceived text complexity model. To do this, we train two BERT models on different datasets in order to make predictions of the average text complexity ratings. The first model is trained on our collected student dataset, whereas the second model is trained on the TCDE dataset. Both models were trained separately since the datasets were annotated in different ways regarding the settings, groups of annotators, rating schemes, and the overall compilation of the sentences. Moreover, training two different models is beneficial because the regression models can weigh the importance of the corresponding features separately.
4.1.1. Training on the Student Dataset
The dataset comprises 1697 unique sentences from the text corpus that were annotated on
average 2.33 times. For each sentence, we calculate the arithmetic mean of the students’
complexity ratings. The pre-trained BERT (Devlin et al., 2019) model
bert-base-german-cased5
and the pre-trained DistilBERT (Sanh et al., 2019) model
distilbert-base-german-cased6
are fine-tuned to predict the average text complexity scores of the sentences. We perform an exhaustive
search with a 5-fold cross-validation to find the best hyperparameters for the model based on the range
of values as suggested by Devlin et al. (2019). In each fold, we fine-tune the model on the
respective test split in order to obtain average predictions for all sentences, which are then used as a
feature in the downstream regression task. The best-performing configuration for the DistilBERT model
is batch_size=32, learning_rate=3e-5 and epochs=3, while for the BERT model, it is
batch_size=32, learning_rate=2e-5 and epochs=2. For the implementation, we use the
Huggingface7
library and configure the model for a regression task by setting the problem_type=‘regression‘
parameter. This results in a linear layer on top of the final hidden state of the [CLS] token, trained
using a mean squared error loss (L2 regression). We then use the resulting predictions as an input
feature for the perceived text complexity models.
4.1.2. Training on the TCDE Dataset
The second model for average predictions is trained on the Text Complexity DE Challenge
dataset (Naderi et al., 2019). DistilBERT (Sanh et al., 2019)
is fine-tuned for the regression task. As Arps et al. (2022) suggested in the
TCDE Challenge, we use the pre-trained distilbert-base-german-cased model and set its
hyperparameters as follows: batch_size=10, learning_rate=2e-5, and epochs=5. After
training, we use this model to make predictions of average values on our student dataset. The
predictions of this model are also used as an input feature for the perceived text complexity
models.
4.2. Feature Selection
| Feature | Description |
|---|---|
| BERT predictions (student dataset) | Predicted average complexity of each sentence by the fine-tuned BERT model trained on our student-annotated dataset |
| Predictions (TCDE dataset) | Predicted average complexity of each sentence by the fine-tuned DistilBERT model trained on the TCDE dataset |
| Out of vocabulary (OOV) | Estimated share of unfamiliar words in a sentence |
| Age | 16; 17; 18 or older |
| Gender | (1) male, (2) non-binary or no answer, (3) female |
| Language at home | (1) German, (2) German and another language, (3) another language |
| German skills (self-stated) | Ranges from very good (1) to very bad (5) |
| Type of training | (1) college, (2) vocational training, (3) not yet decided |
| Field/occupation | (1) STEM, (2) non-STEM, (3) other / not yet decided |
| German grade | Ranges from (1) very good to (6) no answer |
| Maths grade | Ranges from (1) very good to (6) no answer |
| Academic | (1) non-academic high school, (2) academic high school |
In total, twelve features are used to train the regression models in predicting perceived text complexity scores. The features are based on students’ individual characteristics, the predicted labels from the fine-tuned BERT and DistilBERT models, and the vocabulary originating from the GraphVar corpus (Romstadt et al., 2024). The predictions of the BERT models and the ratio of out of vocabulary words are the only linguistic features that we include in the regression model. All remaining features relate to students’ demographic characteristics, information on their language skills, field/occupation and type of training desired after high school, the type of high school, and their school grades in German and Maths. To achieve a better feature interpretation in the SHAP analysis, we use an ordinal encoding for the features gender, language at home, type of training, and field. Additionally, we reduce the field feature characteristics to STEM, non-STEM, and other / not yet decided by merging all answer options that belong to the non-STEM field to get a more balanced feature representation. An overview of all features used is provided in Table 3.
4.3. Perceived Text Complexity Prediction
To incorporate the linguistic and person-related features for the text complexity predictions, several
machine learning models are trained to perform a regression task. Figure 2 illustrates the model
and the sources of input features. We use the student-annotated dataset containing 3954
individually annotated sentences and split the data into \(80\%\) training data and \(20\%\) test data. All models are
optimized using a \(5\)-fold cross-validation for hyperparameter tuning on the training set. In the
following, we give an overview of the regression models and their best hyperparameter
values:
Linear Regression (LR):
A linear regression model (Galton, 1886) aims to explain a linear relationship between a dependent and
multiple independent variables. Using this model, we assume that the input features, such as school
grades or average text complexity predictions, are linearly connected to the perceived text
complexity.
Support Vector Machine (SVM):
A Support Vector Machine (Cortes and Vapnik, 1995) maps input features into a high-dimensional
space using a kernel function, e.g., linear, polynomial, radial basis function (rbf). It aims to find a
hyperplane in this space that best separates the data. Depending on the chosen kernel function, it can be
used to explain linear or non-linear relationships in the data. The hyperparameter values
are set as follows (see Appendix C): kernel=rbf, degree=2, gamma=0.1, C=10,
epsilon=0.01
Multilayer Perceptron (MLP):
A multilayer perceptron (Rumelhart et al., 1986) is a feedforward artificial neural
network that consists of an input layer, multiple hidden layers, and an output layer. Each node, or
neuron, in one layer connects to every node in the following layer, with these connections representing
the weights of the model. Since MLPs can capture non-linearities and interactions between
features, they differ strongly from linear models. The hyperparameter values are set as follows:
activation=tanh, max_iter=20000, hidden_layer_sizes=(100,50),
learning_rate=constant, solver=adam, alpha=0.001
XGBoost (XGB):
XGBoost (Chen and Guestrin, 2016) trains a series of decision trees in a gradient boosting framework.
Each tree attempts to minimize a loss function, which measures the difference between
the predicted and actual values. The hyperparameter values are set as follows: gamma=1,
learning_rate=0.05, n_estimators=100, max_depth=7, min_child_weight=1,
colsample_bytree=0.8, subsample=0.8
K-Nearest-Neighbors (KNN):
K-Nearest-Neighbors (Cover and Hart, 1967) is an instance-based algorithm that saves training data in
a multidimensional space where each dimension represents a feature. When performing a regression
task, its predictions are based on the average (weighted) value of the \(k\)-nearest datapoints that were saved
in the multidimensional space during training. The hyperparameter values are set as follows: k=15,
weights=distance, metric=manhattan
Voting Regressor:
A voting regressor is an ensemble model (Dietterich, 2000) that combines the predictions from multiple
regression models to make a prediction. We evaluate all possible combinations of the base regressors
listed above and adjust the weight of the voting regressor to get the best possible results. We decided to
implement a voting regressor due to the fact that ensemble models can improve robustness and reduce
overfitting.
4.4. SHAP Analysis
SHapley Additive exPlanations (SHAP) (Lundberg and Lee, 2017) is a method to explain the output of machine learning models. It is based on the concepts of game theory, particularly the Shapley value, which is a method for assigning payouts to players depending on their contribution to the total payout. SHAP leverages this concept to explain how each feature in a dataset contributes to a model’s prediction.
To calculate the Shapley value \(\phi _i\) for feature \(i\), the model needs to be retrained on all possible feature subsets \(S \subseteq F\), where \(F\) is the set of all features. A model \(f_{S \cup \{i\}}\) that was trained including feature \(i\) is then compared to a model \(f_{S}\) that is trained excluding feature \(i\). The model’s predictions are subtracted \(f_{S \cup \{i\}}(x_{S \cup \{i\}}) - f_S(x_S)\) on the current input \(x_S\) in the set \(S\) with and without the presence of feature \(i\). SHAP values are described as a weighted average of all possible differences (Lundberg and Lee, 2017):
\(\phi _i = \sum _{S \subseteq F \setminus \{i\}} \frac {|S|!(|F| - |S| - 1)!}{|F|!} \left [f_{S \cup \{i\}}(x_{S \cup \{i\}}) - f_S(x_S)\right ]\).
We use SHAP values to interpret the feature importance of our selected features. Moreover, we analyze how different feature values affect the predictions of our model. Due to the additive property of SHAP values, it is possible to perform the analysis for specific instances.
4.5. Large Language Models Mimicking Students
In-context learning (ICL) refers to the ability of large language models to perform tasks based on examples provided in the input prompt, without updating the model parameters. This approach was investigated by Brown et al. (2020), who demonstrated that autoregressive models such as GPT-3 can generalize to new tasks through a small number of examples provided at inference time (few-shot learning). Building on this idea, we employ role-play prompting, which is a specific prompt engineering method that lets a large language model (LLM) assume a certain role or persona by giving it a description of the characteristics of that person. Recent studies have shown that role-play prompting can improve the performance of LLMs when it comes to executing specific tasks (Kong et al., 2024). To evaluate current state-of-the-art LLMs for determining the perceived text complexity, we test the capabilities of ChatGPT8 and Claude9 in annotating sentences from the students’ point of view. Therefore, we use the separate surveys from each of the 193 students that contain eight person-related questions and twenty German sentences. The student profiles vary by age, gender, language spoken at home, self-reported German proficiency, current school type, intended post-secondary education, field of study, and grades in German and Maths. We parse these characteristics into multiple textual descriptions that serve as role-play prompts for ChatGPT and Claude. To ensure that the LLMs annotate from the perspective of a German student and avoid potential confusion arising from translation errors – such as those related to differing educational or grading systems – we present all queries in the German language. An example of a prompt that was translated into English is as follows: Imagine you are the described person: You are 17 years old. You are a boy. You mainly speak a language other than German at home. You rate your German language skills as average. Your last school grade in German was satisfactory (C). Your last school grade in Maths was good (B). You are interested in social professions or social or economic sciences. You are currently attending a grammar school.
In addition to the description of the persona, the twenty sentences that were originally annotated by the corresponding student are provided. In the query, we emphasize the importance of annotating the sentences from the perspective of the described student. Also, we ask the LLMs to provide the results of the text complexity as perceived by the specific role-play prompted student.
In the zero-shot scenario, all human-annotated labels are removed, and ChatGPT and Claude
annotate all sentences from the survey without having seen any exemplar annotations by the
student beforehand. Then, this process is repeated, but the LLMs are given a fixed number
of examples consisting of sentences and their assigned labels. We randomly select 2, 4,
6, 8, 10, and 12 sentences per survey and reveal the assigned labels to the large language
models.
All prompts are executed by utilizing Anthropic’s API for Claude and OpenAI’s API for ChatGPT. We
use the most recent models, Claude Sonnet 3.5 (version: claude-3-5-sonnet-20240620) and
ChatGPT-4o (version: gpt-4o-2024-08-06). The temperature of the models is set to 0 to reduce
variability and improve the consistency of the answers.
5. Results
In this section, the predictions of the text complexity models are evaluated. We interpret the results of our best model using a SHAP analysis and see how the features impact the predictions of our model. As our main evaluation metric, we use the root mean squared error (RMSE), which is defined as
\( RMSE = \sqrt {\frac {1}{M} \sum _{i=1}^{M} \big (y^{(i)} - \hat {y}^{(i)}\big )^2}\),
where \(M\) is the number of observations, \(y^{(i)}\) is the actual value of the observation \(i\) and \(\hat {y}^{(i)}\) is the predicted value for observation \(i\). Due to its high interpretability and heavy penalization of large errors, the RMSE is well-suited for the evaluation of the models. We apply bootstrapping to estimate the uncertainty of our RMSE. In a final step, we analyze the capabilities of LLMs mimicking students based on the described role-play prompts.
5.1. Model Evaluation
The evaluation of the regression models is split into two parts. First, the student data model for the average text complexity predictions is evaluated. Then, we compare the models that incorporate person-related features.
5.1.1. Average Text Complexity
| Model | RMSE \(\pm \) Std. |
|---|---|
| bert-base-german-cased | \(0.931 \pm 0.057\) |
| distilbert-base-german-cased | \(\textbf {0.927} \pm 0.058\) |
We measure the quality of the results for the average text complexity models. As shown in Table 4, the bert-base-german-cased model achieves an RMSE of 0.931, while the lowest RMSE of 0.927 is obtained by fine-tuning the distilbert-base-german-cased model. The results suggest that DistilBERT is slightly better suited for the task, as it achieves a lower RMSE while maintaining a comparable standard deviation across folds. Therefore, we use its predictions as an input feature for training the perceived text complexity models.
5.1.2. Perceived Text Complexity
| Model | RMSE \(\pm \) Std. | \(R^2\) |
|---|---|---|
| Baseline (Mean) | \(1.070 \pm 0.012\) | \(0.000\) |
| Avg. Text Complexity (BERT) | \(1.036 \pm 0.013\) | \(0.061\) |
| Linear Regression (LR) | \(0.965 \pm 0.026\) | \(0.168\) |
| Support Vector Regression (SVR) | \(0.866 \pm 0.019\) | \(0.329\) |
| XGBoost (XGB) | \(0.855 \pm 0.023\) | \(0.348\) |
| Multilayer Perceptron (MLP) | \(0.836 \pm 0.024\) | \(0.375\) |
| K-Nearest-Neighbors (KNN) | \(0.836 \pm 0.024\) | \(0.375\) |
| LR + XGB | \(0.890 \pm 0.022\) | \(0.292\) |
| LR + MLP | \(0.861 \pm 0.023\) | \(0.337\) |
| LR + SVR | \(0.859 \pm 0.020\) | \(0.341\) |
| KNN + LR | \(0.854 \pm 0.022\) | \(0.349\) |
| SVR + MLP | \(0.836 \pm 0.023\) | \(0.376\) |
| KNN + SVR | \(0.828 \pm 0.022\) | \(0.388\) |
| SVR + XGB | \(0.824 \pm 0.021\) | \(0.393\) |
| XGB + MLP | \(0.824 \pm 0.023\) | \(0.393\) |
| KNN + MLP | \(0.824 \pm 0.024\) | \(0.394\) |
| KNN + XGB | \(\mathbf {0.822 \pm 0.024}\) | \(\mathbf {0.396}\) |
As baseline models, we use the arithmetic mean of all annotated labels from the training dataset and the average text complexity model trained on the self-collected student dataset. A comparison of all models is illustrated in Table 5. It shows that all regression models trained on person-related features outperform the baseline models when predicting the text complexity as perceived by students. K-nearest-Neighbors (KNN) and Multilayer Perceptron (MLP) are the best single regressors since both models achieve an RMSE of 0.836 and an \(R^2\)-Score of 0.375. Therefore, most of the ensemble models that include KNN or MLP outperform the other models. The best results are achieved by combining KNN and XGB into a voting regressor with the following weights: KNN: \(0.55\), XGB: \(0.45\). This model has an RMSE of 0.822 and an \(R^2\)-Score of 0.396. It is noticeable that creating ensembles of the regression models leads to better results since many of the ensemble models outperform the best single regression model. Even an ensemble model consisting of two weaker models, like Support Vector Regression and XGBoost, achieves better results than any of the single regression models.
5.2. Model Explanation
To get a better understanding of our machine learning model and the relevance of the input features, a SHAP analysis is performed. Thus, we analyze how the different features influence the predictions of our model. All model explanations refer to the best performing model, i.e., the voting regressor consisting of KNN (55%) and XGB (45%).
5.2.1. Feature Importance
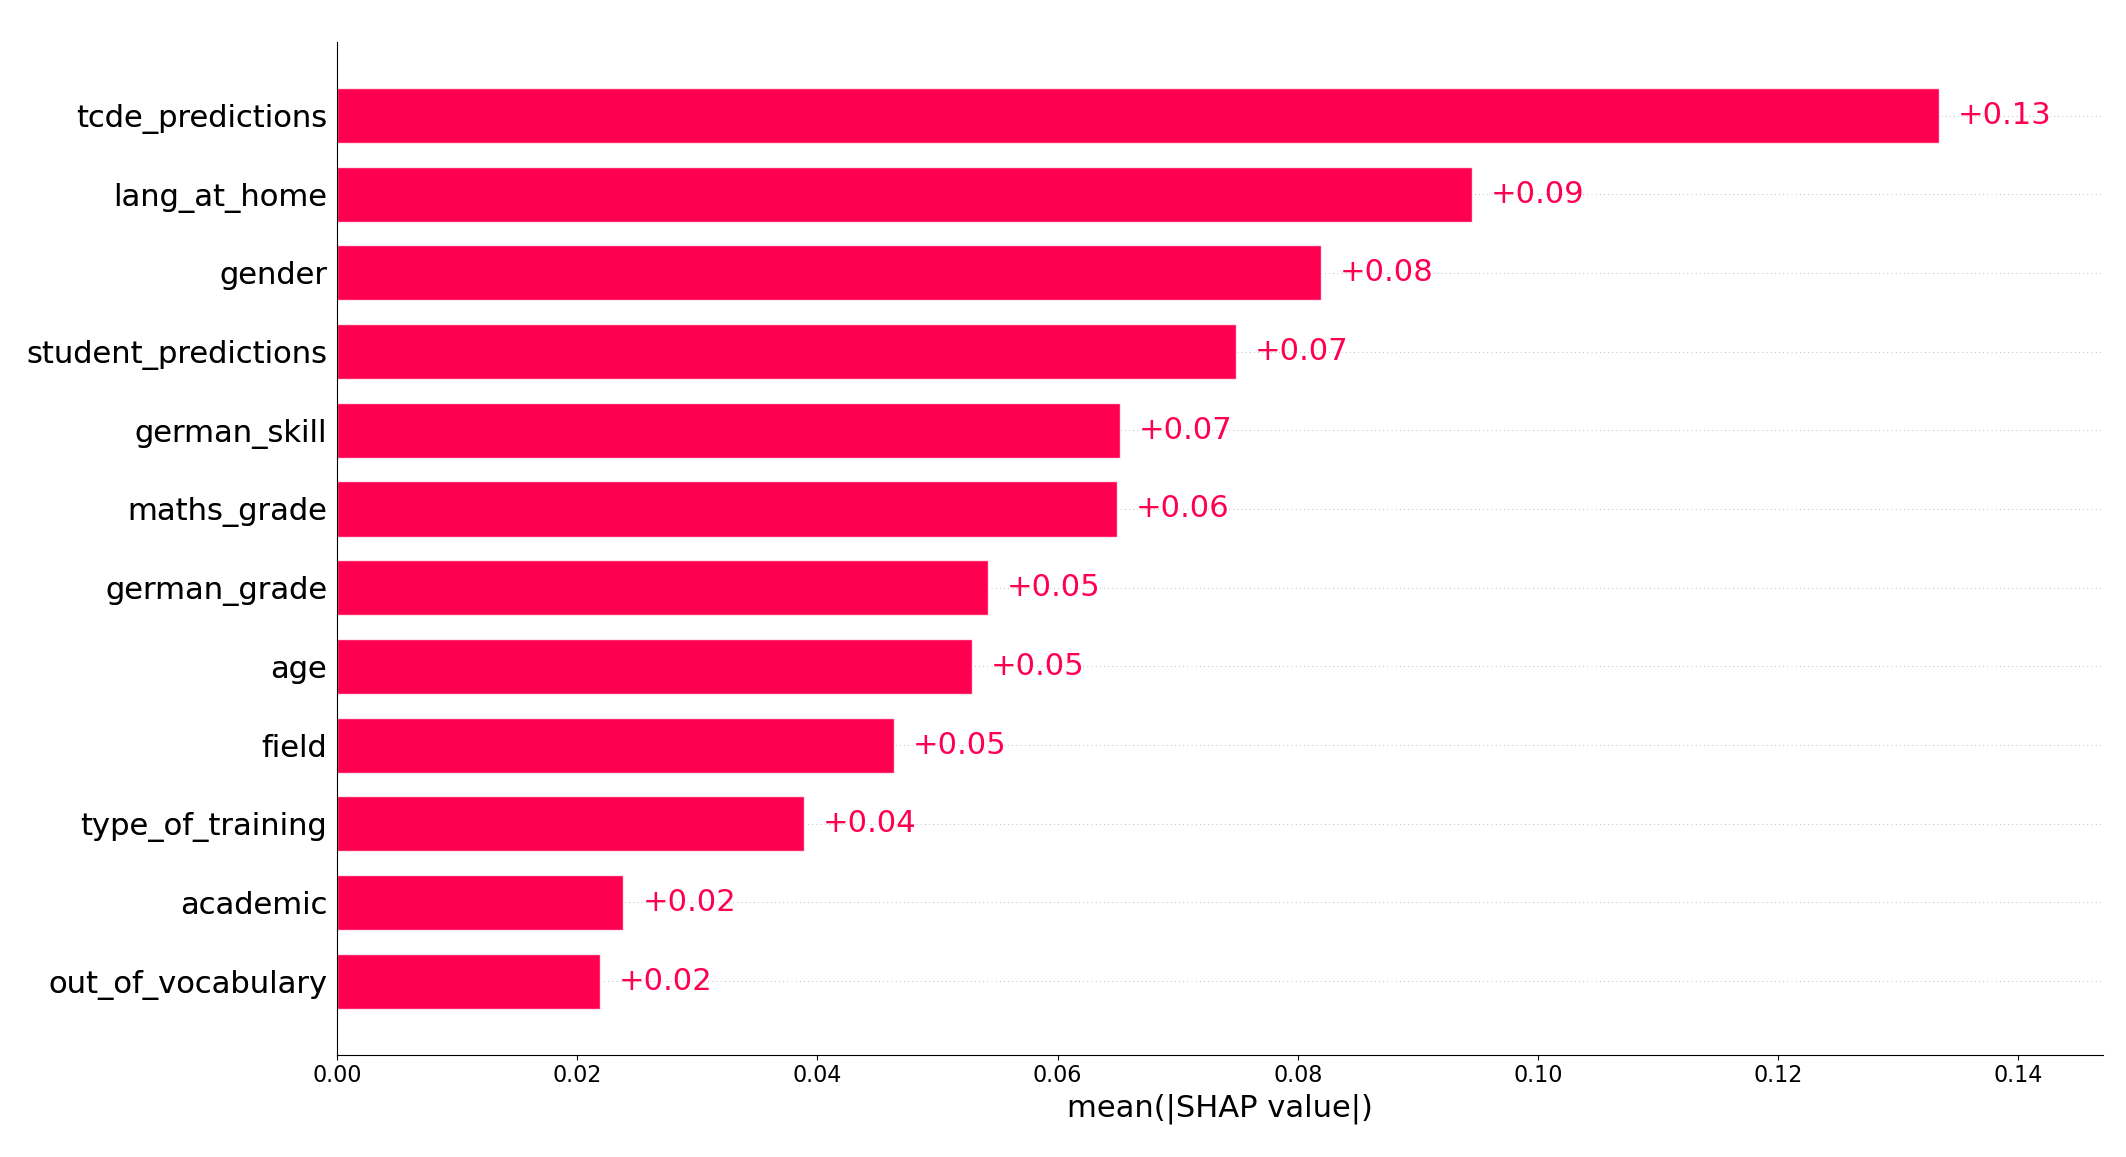
Feature importance is measured by the mean absolute SHAP values aggregated over all instances and is shown in Figure 3. The \(x\)-axis shows the mean absolute Shapley values of the features that are displayed on the \(y\)-axis. A higher value reflects that the feature has a higher impact on the predictions of the model.
With a mean absolute SHAP value of 0.13, the TCDE predictions are the most relevant feature for our predictions and even have a higher importance than the student predictions with a SHAP value of 0.07. This might be explained by the fact that the sentences in the TCDE dataset are annotated on average 9.5 times, whereas the sentences in the student dataset are on average annotated 2.33 times. Due to the larger number of annotations per sentence, the TCDE dataset seems to be better suited for fine-tuning a model used to make average text complexity value predictions. The third linguistic feature, out-of-vocabulary, achieved a rather low feature importance of 0.02. Although having a rather low feature importance, the feature still has a positive effect on our model’s performance (see Appendix D), but is more complex to interpret because it also depends on the student’s vocabulary.
Regarding the person-related features, the language the students speak at home is the most influential aspect for the model, achieving a feature importance score of 0.09. We assume that this feature represents a large part of the amount of exposure a student has to the German language. It is worth noting that the gender of the students is the second most significant person-related feature. It has a relatively high feature importance of 0.08, indicating that perceptions of text complexity differ by gender. Also, the self-estimated German skill has a feature importance of 0.07 and seems to be of higher importance than their actual German grade. Overall, a combination of students’ self-estimations, gender identities, and amount of exposure to the German language are the most relevant student-related features.
5.2.2. Impact of Features
To get a deeper understanding of how the features affect the model’s predictions, we further examine the Shapley values of each instance. A positive Shapley value indicates that the predicted value has increased, meaning that the model assesses the text as more complex. On the other hand, a negative Shapley value indicates the opposite, i.e. a lower value for the predicted text complexity.
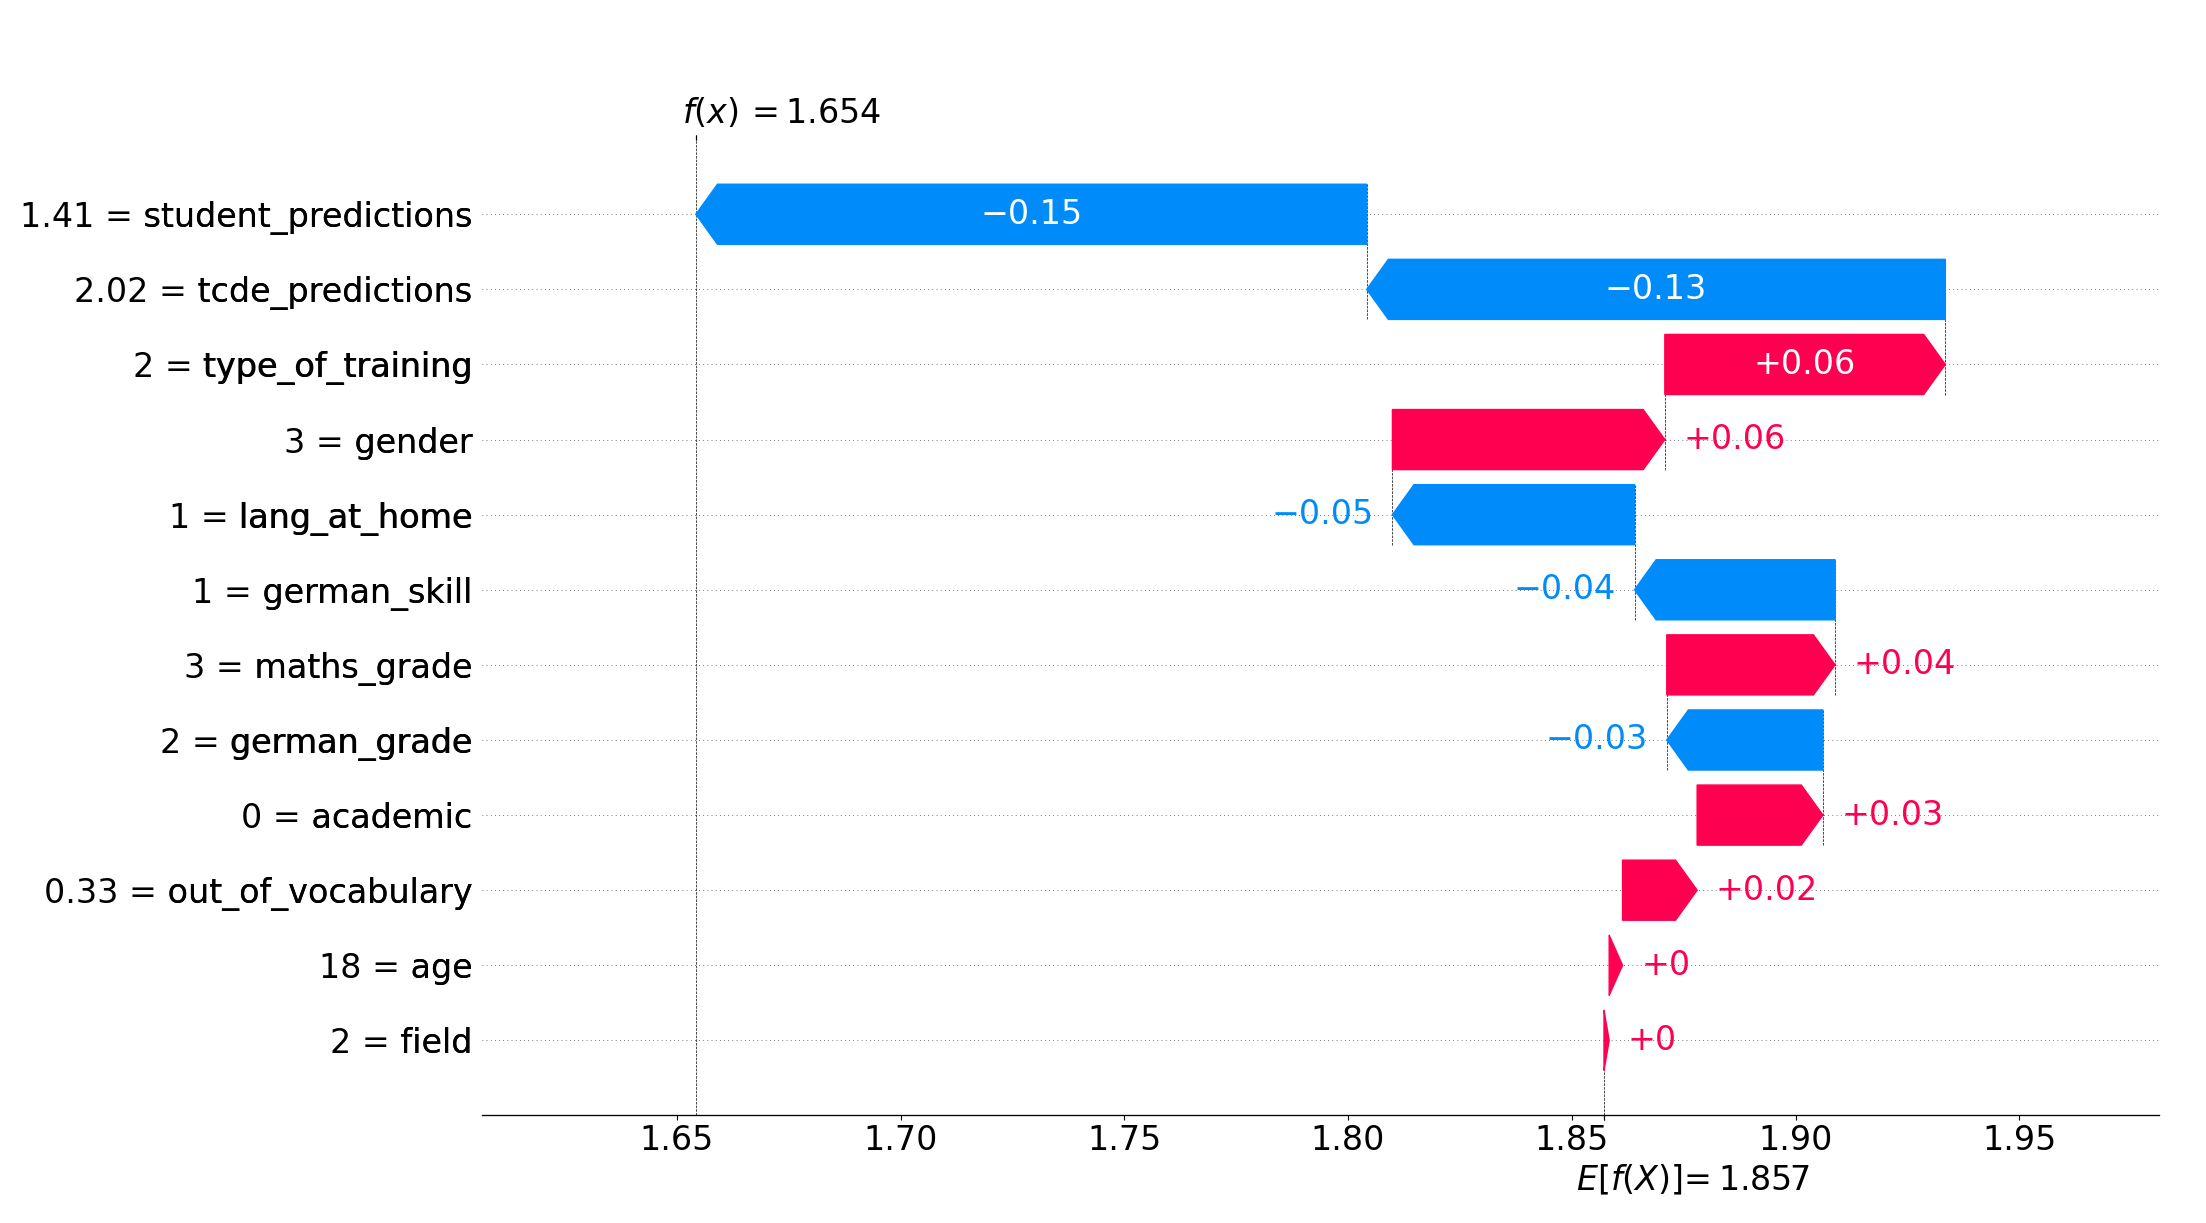
Figure 4 shows an example of the feature impacts when predicting the perceived text complexity of a specific instance. This sentence originally got labelled as very easy by the student. It demonstrates how each feature contributes to the difference between the actual prediction \(f(x)=1.654\) and the average predictions \(E[f(x)]=1.857\) of the model. The \(x\)-axis shows the text complexity score, and the actual feature values are displayed on the \(y\)-axis. In this example, the average predictions of the student model and the TCDE model have the highest impact on the prediction. Since both models assigned rather low text complexity values, the resulting prediction gets shifted downwards by \(-0.15\) and \(-0.13\). Additionally, the student states to speak German at home, which again makes the model reduce the value for the text complexity prediction by \(-0.05\). Other factors, such as the student attending a non-academic high school, a higher number of out-of-vocabulary words, and average grades in maths, slightly increase the model’s predicted text complexity for this instance.
Figure 5 provides an overview of each feature’s impact on the model’s predictions. Each instance is represented by a dot on the feature rows. The position of each dot on the \(x\)-axis depends on the SHAP value of the feature for that specific instance. A color gradient, ranging from blue to red, represents the features’ characteristics and reflects the intensity of their values. Besides the fact that the TCDE predictions have the greatest impact on our model, they also have a mostly linear relationship with the model’s predictions. As the feature value increases, the SHAP value increases and vice versa. For the feature language at home, the students had three answering options: (1) German, (2) German and another language, and (3) another language. Especially the students who solely speak German at home perceive the texts as being less complex. In contrast, the students who either speak another language or German and another language at home, perceive the texts as more complex. This effect can be seen by the clear separation of the blue and red dots in Figure 5 and is even more pronounced across students who report not speaking any German at home.
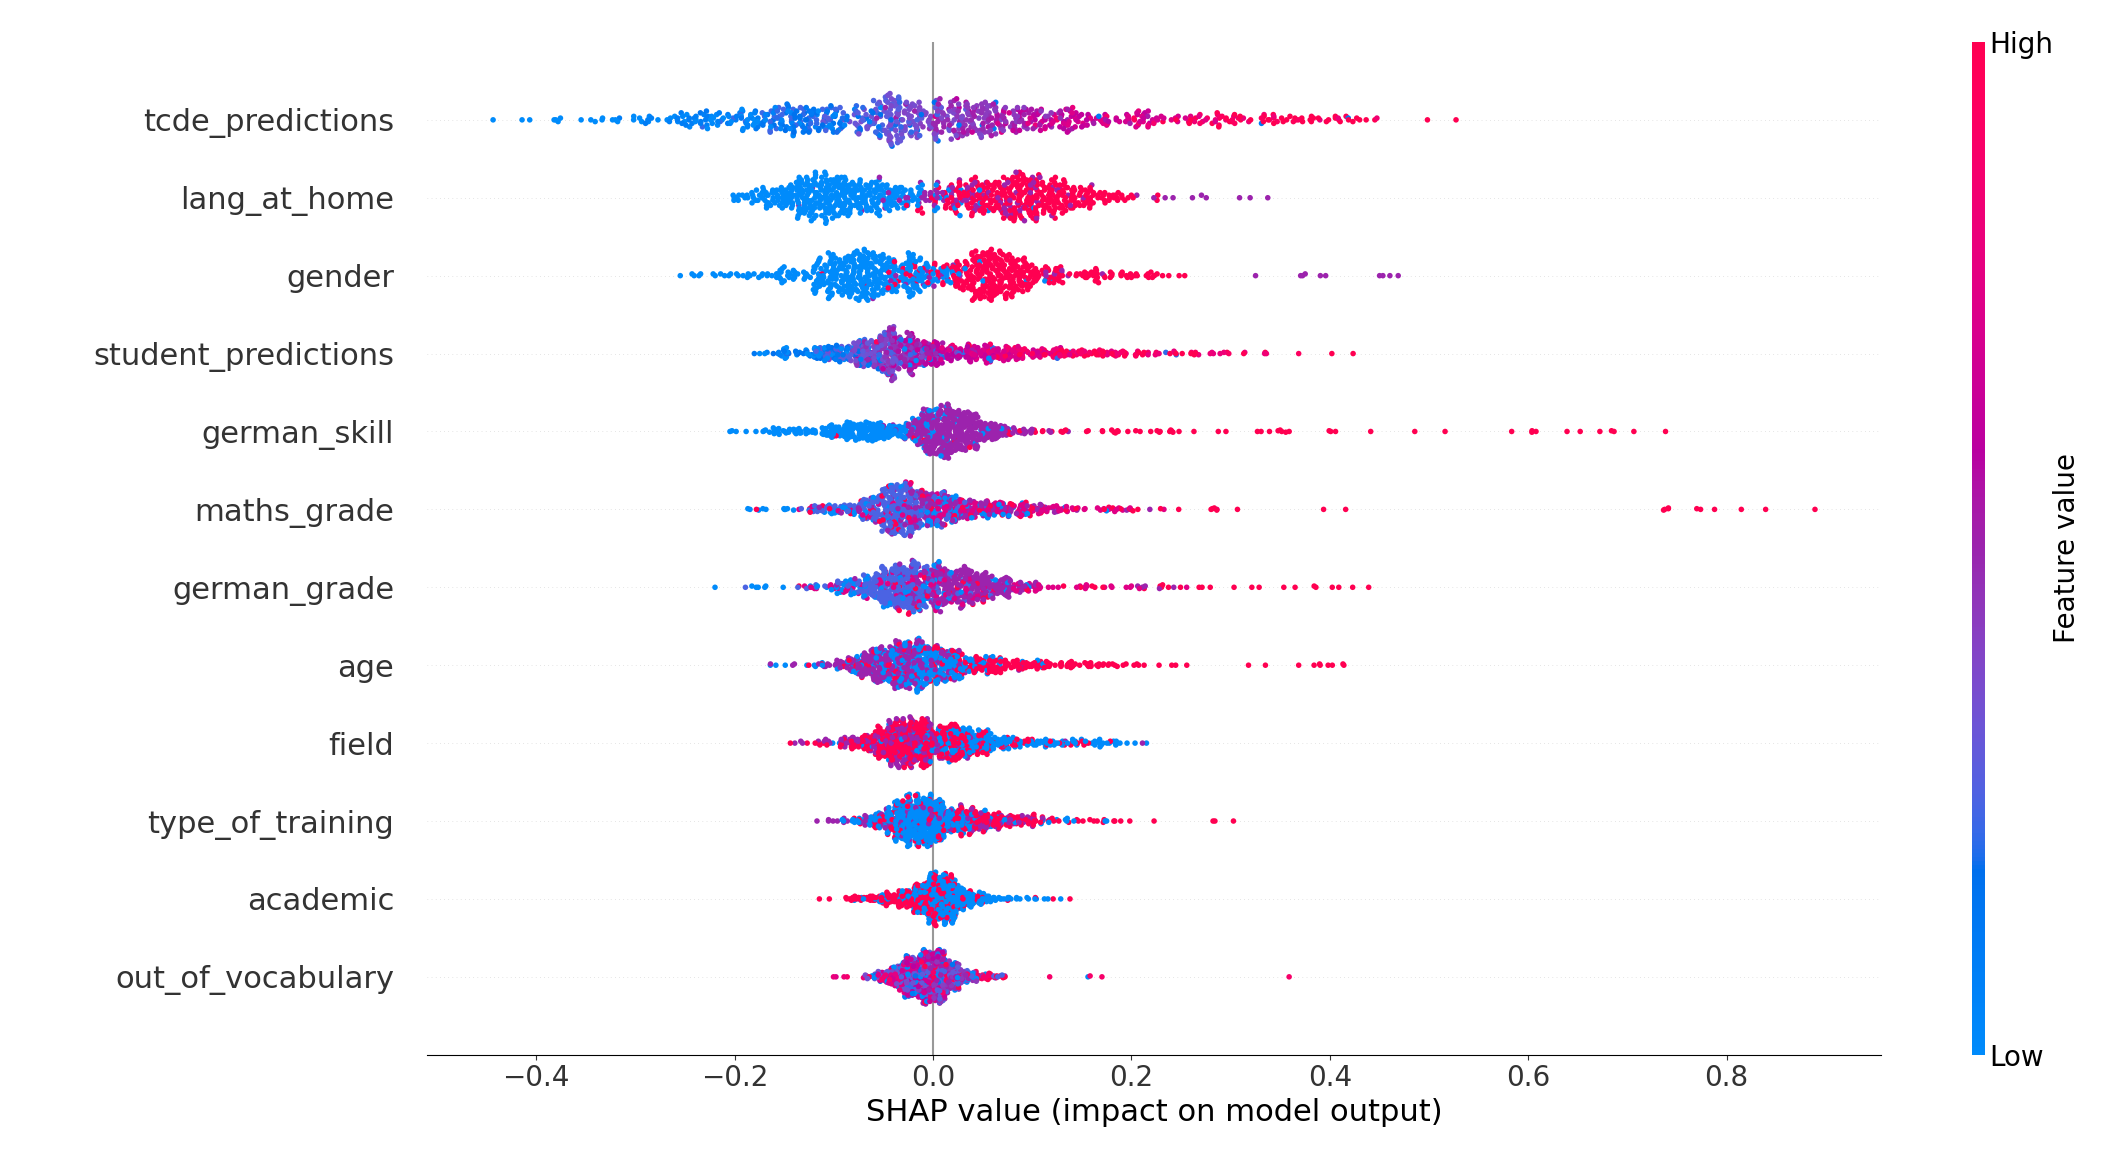
There is also a noticeable distinction between male and female students: the model tends to rate sentences as less complex when the reader is male (blue dots in Figure 5 for gender) and as more complex when the reader is female (red dots). This relationship can be explained by male teenagers’ overconfidence, which made them rate the sentences as less complex compared to female students (Cooper et al., 2018). Students who stated being non-binary or gave no answer are represented by the purple dots (we note that only 10 students fall into this category). The few purple dots either accumulate in the middle area or on the right-hand side of the SHAP values, which stands for a high text complexity value.
Also, the self-stated German skill of the students affects the predictions of the model. For this feature, a low value (blue) means that the student has stated to have a very good German skill, whereas a higher feature value (red) stands for a very bad German skill. This feature seems almost to be linearly connected to the predictions of the model, with a better estimation of their own language abilities resulting in lower values for the text complexity annotations. While most of the students stated to have very good or good German skills, fewer students rated their German skills as average or worse. If students have stated to have very bad German skills, their SHAP value increases immensely. Therefore, the model expects these students to assign higher text complexity values.
5.2.3. Role-play Model Evaluation
Finally, we evaluate Claude and ChatGPT by regarding sentences with revealed labels as few-shot examples and sentences with removed labels as a test set. For each prompt, we collect the suggested labels from the output and compare them to the human-labelled annotations. Both Claude and ChatGPT are queried with the same prompts for comparison. We start by role-playing in a zero-shot scenario where the LLMs do not see any revealed labels within the prompts. After that, we repeat this process but reveal a fixed number of examples to the LLMs.
| ChatGPT | Claude | Revealed |
|---|---|---|
| (RMSE) | (RMSE) | Labels |
| 1.961 | 1.864 | 0 |
| 1.554 | 1.579 | 2 |
| 1.327 | 1.462 | 4 |
| 1.286 | 1.437 | 6 |
| 1.245 | 1.367 | 8 |
| 1.180 | 1.308 | 10 |
| 1.171 | 1.252 | 12 |
Table 6 shows that Claude and ChatGPT clearly benefit from having received more examples with revealed labels. For both models, the zero_shot approach leads to a very high root mean square error (RMSE). By increasing the number of examples in the prompt to \(12\), Claude’s RMSE decreases by \(0.61\), and ChatGPT’s RMSE decreases by \(0.79\), compared to the zero-shot approach. Except for the zero-shot setting, Claude is always outperformed by ChatGPT, assuming both models have seen the same number of examples. Even though the performance can be improved by increasing the number of few-shot examples, both models perform worse than a baseline model that simply predicts the arithmetic mean for each label (RMSE of 1.070).
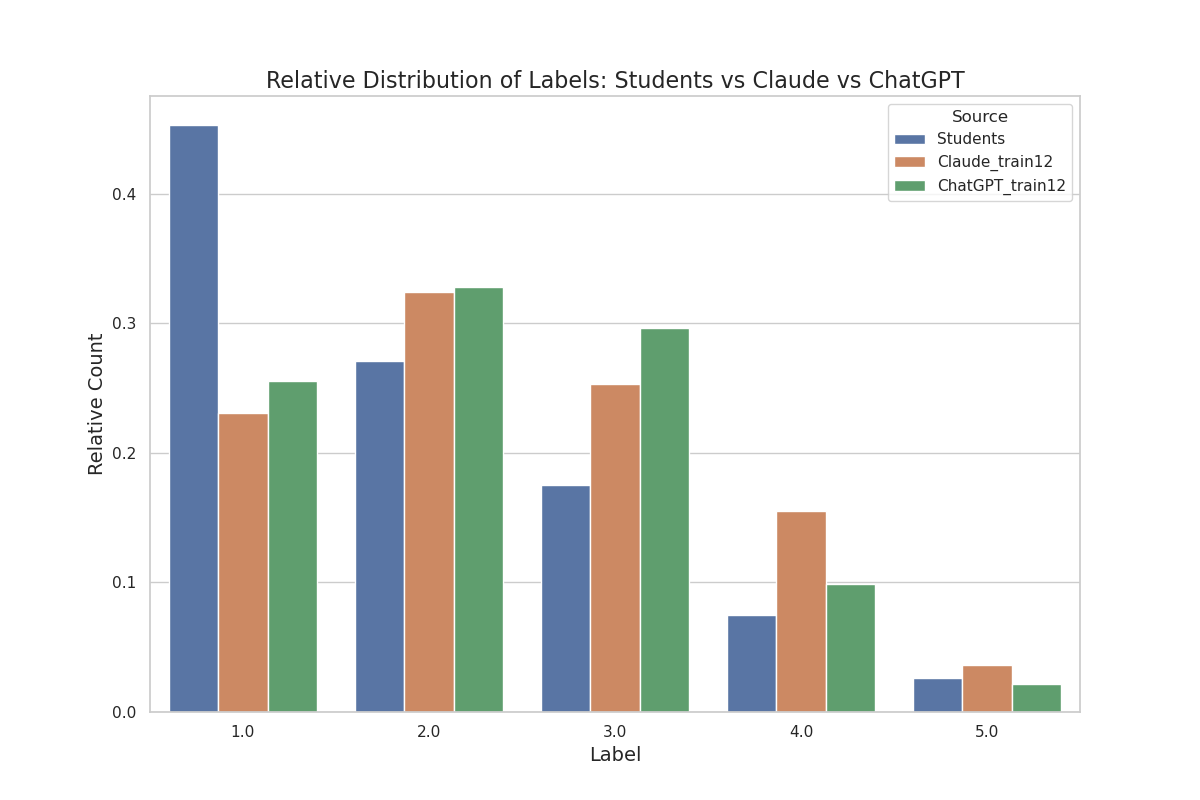
In Figure 6, we compare the relative distribution of labels between the students and the role-play models. For better interpretation, we focus on the best-performing role-play models that have seen the highest amount of example annotations before assigning any labels. It is noticeable that the label distribution of the role-play models differs from the actual distribution, especially when looking at label (1) very easy. The students’ annotations peak at the very easy label as this label was assigned in \(45.27\%\) of the sentences from the test dataset, whereas both role-play models peak at label (2) easy. In contrast to that, only about a quarter of the sentences have been labelled as very easy by ChatGPT and Claude. On average, Claude assigns a value of 2.44, which is slightly higher than the value that ChatGPT assigns on average (2.30), indicating that Claude expects students to perceive the sentences as more complex than ChatGPT and significantly more complex than the real students, who have an average value of 1.93.
6. Discussion
Our analysis provides valuable insights into how teenagers perceive text complexity, based on a
detailed investigation of sentence-level judgments collected from German-speaking students. While
the findings offer meaningful contributions to understanding perceived complexity in this
population, they must be interpreted within the specific linguistic and demographic context of the
study. All data was collected in German, using prompts tailored to the language, and we
employed language-specific models alongside German prompts for large language models like
ChatGPT and Claude. Linguistic features specific to German, such as syntactic structure and
morphological complexity, may have influenced both human judgments and model outputs.
Furthermore, cultural and educational background factors specific to German-speaking
students likely shaped how text complexity was perceived. Therefore, our results are most
directly applicable to German-speaking students and may not directly generalize to other
languages or demographic groups without further investigation. This might also explain why
models like ChatGPT and Claude, which are typically optimized to reflect broader user
preferences through techniques like reinforcement learning from human feedback, showed
limitations in predicting student-specific ratings of complexity. Their responses may align well
with general trends, as shown in studies like (Zheng et al., 2023), but not
necessarily with narrower or demographically distinct groups such as teenagers in an educational
context.
Addressing a notable gap in the literature, this paper focuses specifically on high school students’ perceptions of text complexity, a group largely overlooked in existing research. The results in section 5 show that including person-related features helps to make more accurate predictions on how students perceive a written piece of information. Unlike previous studies that primarily involve language learners (Santucci et al., 2020) or experts (Seiffe et al., 2022), we provide a comprehensive analysis that accounts for the diverse demographic and language backgrounds of the teenagers. By incorporating these person-related features and utilizing a large dataset of annotated texts, our work enhances the understanding of how students perceive text complexity in relation to their unique backgrounds. Furthermore, we move beyond traditional models that rely solely on linguistic features by integrating person-related features to more accurately reflect the complexities of students’ perceptions. This multifaceted approach not only broadens the scope of text complexity research but also contributes valuable insights into effective communication strategies tailored to young readers.
Thus, our model offers potential applications in enhancing adaptive learning systems by analyzing how students perceive various sections of a text. Despite the texts in our study having relatively low FRE scores, indicating rather complex linguistic structures, many students rated most of the sentences as very easy. We thus assert that students tend to overestimate their ability to understand texts. This aligns with prior research indicating that the evaluation of one’s own thought processes, known as metacognition, is often biased (Dunlosky and Metcalfe, 2008). Comparing students’ self-assessments with objective measures of text complexity can help identify gaps in understanding and more effectively address weaknesses in knowledge acquisition through reading.
Beyond that, our findings show that using LLMs to mimic students’ perceptions proved to be insufficient. While these models can generate text and simulate certain linguistic characteristics, they seem to lack the nuanced understanding of individual backgrounds and experiences that influence how students perceive texts. Specifically, they fail to adjust to the dataset’s strong skewness and cannot replicate students’ behavior in text complexity annotations.
Our comprehensive data collection, although very resource-intensive, yields invaluable insights directly from high school students. By engaging with a diverse group of annotators, we were able to capture the complexities of their perceptions and the unique factors that shape their understanding of texts. This direct approach not only enhances the validity of our findings but also underscores the importance of human input in developing models that accurately reflect the experiences of real-world learners.
There are some limitations to our study that warrant consideration. First, our research concentrates on measuring text complexity as perceived by teenagers, but it does not directly evaluate their ability to process and comprehend the presented information. This distinction is important as a text may be perceived as complex yet still be understood effectively, or vice versa. Future research could consider incorporating comprehension assessments to establish a more comprehensive understanding of how perceived complexity correlates with actual information processing. This is, however, beyond the purpose of our paper.
Second, the model is based on a self-collected dataset of 3,954 sentences annotated by 193 high school students. Yet, despite the large number of sentences and the diversity of annotating students, we may still not fully capture the breadth of linguistic diversity present among all high school students. Factors such as regional dialects, cultural nuances, and varying levels of exposure to academic language could affect students’ perceptions of text complexity but may not be adequately represented in our data. Also, it could be possible that different demographic factors interact with each other and affect text perceptions differently. Thus, the model’s accuracy in predicting perceived text complexity may be influenced by biases inherent in the dataset, in our model, or the selected demographic features during the surveys. While our findings are promising, further validation in diverse educational contexts and among people with even greater demographic heterogeneity is necessary to improve the model and our understanding of perceived text complexity. Future research could also employ different models, including interactions between the students’ demographic characteristics and their abilities, to facilitate a deeper understanding of the underlying mechanisms at play.
Third, although previous work highlights the need for model-specific prompt engineering, we used the same prompts for both ChatGPT and Claude to maintain consistency across models. This may have limited their performance, as the prompts were not optimized for the specific characteristics of each LLM. Future work could investigate whether model-specific prompt tuning leads to more accurate simulations of student behavior.
7. Conclusion
In this paper, we investigate whether incorporating person-related features in machine learning models improves the prediction of perceived text complexity. The study is based on self-collected data that comprise 1697 unique sentences annotated by a total of 193 German high school students. Most sentences were extracted from study guides intended to inform students about potential post-secondary pathways.
By utilizing our annotated dataset, multiple regression models are trained to predict the perceived text complexity based on different student profiles and a few linguistic features. Our findings show that K-Nearest-Neighbors (KNN), Multilayer Perceptron (MLP), and ensemble models perform well in predicting the perceived text complexity. Our findings also reveal that ChatGPT and Claude are not able to produce accurate annotations mimicking the real student profiles. Providing the LLMs with multiple examples of annotated sentences enhances their performance in role-play prompting. However, even with this improvement, the role-playing LLMs still do not surpass any of the baseline models.
Most importantly, all regression models that incorporate person-related features outperform the baseline models that predict average text complexity values. A SHAP analysis reveals that the students’ language they speak at home, gender, and self-estimation of German skills play a decisive role in the predictions of our model.
While metacognition is inherently subjective (Dunlosky and Metcalfe, 2008), assessing perceived text complexity remains highly relevant. Readers’ subjective perception of complexity influences their engagement, motivation, and ability to process information effectively. Adjusting texts based on perceived difficulty can enhance comprehension and encourage sustained reading effort, making it a key factor in fields such as education, healthcare, and politics (Leroy et al., 2010, Tolochko et al., 2019). In these domains, ensuring that information is not only objectively accessible but also perceived as approachable can improve learning outcomes, facilitate informed decision-making, and foster greater public understanding.
Bullet points generated by LLMs may serve as a convenient alternative for summarizing content. However, this approach comes with some limitations. Summaries provided by LLMs are prone to omitting key details or context, depending on the quality and specificity of the prompts used (Benedetto et al., 2024). Thus, using LLMs to summarize texts can lead to oversimplification or misrepresentation of the material. As a result, such summaries may fail to adequately convey the nuances of the original text, hindering the audience’s ability to fully engage with or comprehend the content.
In future work, our proposed method could serve as a valuable tool for enhancing generative models to better accommodate the needs of diverse target groups beyond language learners or individuals with low literacy levels. While existing tools primarily focus on text simplification, tailoring texts to teenagers from various backgrounds could facilitate information processing and support their transition from secondary to post-secondary education. Furthermore, our model could be leveraged to recommend academic texts based on perceived text complexity or be integrated into adaptive learning systems that detect students’ overestimation of their comprehension in specific parts of a text.
Finally, our dataset should be extended in the future to include other subgroups of the population, and not only high school students. It is possible that the impact of specific person-related features differs if other groups than students are considered. This is up to future research.
While this study shows that person-related factors can have a great impact on the perceived text complexity, there still remains a gap between perceived and actual text complexity. The perception of the students could be influenced from an over- or underestimation of their own abilities. Therefore, future works should focus on measuring the distortion that is caused by these effects. This might reveal weaknesses of specific target groups when it comes to understanding written texts.
8. Acknowledgements
This work was funded by the Federal Ministry of Education and Research (BMBF) and Next Generation EU as part of the project “NLP in Education Research: Development of the German higher education market since the 1970s (Studi-BUCH)”; grant numbers 16DKWN139A and 16DKWN139B.
Declaration of Generative AI Software Tools in the Writing Process
During the preparation of this work, the authors used ChatGPT in all sections of the paper in order to ensure the correctness of grammar, wordings, and improve the style of writing. After using this tool, the authors reviewed and edited the content as needed and take full responsibility for the content of the publication.
References
- Al-Thanyyan, S. S. and Azmi, A. M. 2021. Automated text simplification: A survey. ACM Computing Surveys 54, 2, 1–36.
- Amstad, T. 1978. Wie verständlich sind unsere Zeitungen? Studenten-Schreib-Service.
- Anderson, J. 1983. Lix and Rix: Variations on a little-known readability index. Journal of Reading 26, 6, 490–496.
- Arps, D., Kels, J., Krämer, F., Renz, Y., Stodden, R., and Petersen, W. 2022. HHUplexity at text complexity DE challenge 2022. In Proceedings of the GermEval 2022 Workshop on Text Complexity Assessment of German Text, S. Möller, S. Mohtaj, and B. Naderi, Eds. Association for Computational Linguistics, Potsdam, Germany, 27–32.
- Bar-Haim, R., Eden, L., Friedman, R., Kantor, Y., Lahav, D., and Slonim, N. 2020. From arguments to key points: Towards automatic argument summarization. In Proceedings of the 58th Annual Meeting of the Association for Computational Linguistics, D. Jurafsky, J. Chai, N. Schluter, and J. Tetreault, Eds. Association for Computational Linguistics, Online, 4029–4039.
- Bast, H. and Korzen, C. 2017. A benchmark and evaluation for text extraction from PDF. In 2017 ACM/IEEE Joint Conference on Digital Libraries (JCDL). IEEE, 1–10.
- Benedetto, L., Aradelli, G., Donvito, A., Lucchetti, A., Cappelli, A., and Buttery, P. 2024. Using LLMs to simulate students’ responses to exam questions. In Findings of the Association for Computational Linguistics: EMNLP 2024, Y. Al-Onaizan, M. Bansal, and Y.-N. Chen, Eds. Association for Computational Linguistics, Miami, Florida, USA, 11351–11368.
- Bock, K. H. 1974. Studien- und Berufswahl - Entscheidungshilfen für Abiturienten und Absolventen der Fachoberschulen. Number 1. Verlag Karl Heinrich Bock.
- Brown, T., Mann, B., Ryder, N., Subbiah, M., Kaplan, J. D., Dhariwal, P., Neelakantan, A., Shyam, P., Sastry, G., Askell, A., et al. 2020. Language models are few-shot learners. Advances in Neural Information Processing Systems 33, 1877–1901.
- Chen, T. and Guestrin, C. 2016. XGBoost: A scalable tree boosting system. In Proceedings of the 22nd ACM SIGKDD International Conference on Knowledge Discovery and Data Mining. KDD ’16. Association for Computing Machinery, New York, NY, USA, 785–794.
- Cooper, K. M., Krieg, A., and Brownell, S. E. 2018. Who perceives they are smarter? Exploring the influence of student characteristics on student academic self-concept in physiology. Advances in Physiology Education 42, 2, 200–208.
- Cortes, C. and Vapnik, V. 1995. Support-vector networks. Machine Learning 20, 273–297.
- Cover, T. and Hart, P. 1967. Nearest neighbor pattern classification. IEEE Transactions on Information Theory 13, 1, 21–27.
- Dahl, A. C., Carlson, S. E., Renken, M., McCarthy, K. S., and Reynolds, E. 2021. Materials matter: An exploration of text complexity and its effects on middle school readers’ comprehension processing. Language, Speech, and Hearing Services in Schools 52, 2, 702–716.
- Devlin, J., Chang, M.-W., Lee, K., and Toutanova, K. 2019. BERT: Pre-training of deep bidirectional transformers for language understanding. In Proceedings of the 2019 Conference of the North American Chapter of the Association for Computational Linguistics: Human Language Technologies, Volume 1 (Long and Short Papers). Association for Computational Linguistics, Minneapolis, Minnesota, 4171–4186.
- Dietterich, T. G. 2000. Ensemble methods in machine learning. In Multiple Classifier Systems, J. Kittler and F. Roli, Eds. Springer Berlin Heidelberg, Berlin, Heidelberg, 1–15.
- Dunlosky, J. and Metcalfe, J. 2008. Metacognition. Sage Publications.
- Espinosa-Zaragoza, I., Abreu-Salas, J., Lloret, E., Moreda, P., and Palomar, M. 2023. A review of research-based automatic text simplification tools. In Proceedings of the 14th International Conference on Recent Advances in Natural Language Processing, R. Mitkov and G. Angelova, Eds. INCOMA Ltd., Shoumen, Bulgaria, Varna, Bulgaria, 321–330.
- Flesch, R. 1948. A new readability yardstick. Journal of Applied Psychology 32, 3, 221.
- Fulmer, S. M., D’Mello, S. K., Strain, A., and Graesser, A. C. 2015. Interest-based text preference moderates the effect of text difficulty on engagement and learning. Contemporary Educational Psychology 41, 98–110.
- Galton, F. 1886. Regression towards mediocrity in hereditary stature. The Journal of the Anthropological Institute of Great Britain and Ireland 15, 246–263.
- Gilardi, F., Alizadeh, M., and Kubli, M. 2023. ChatGPT outperforms crowd-workers for text-annotation tasks. Proceedings of the National Academy of Sciences 120, 30 (July), e2305016120.
- Gooding, S. and Tragut, M. 2022. One size does not fit all: The case for personalised word complexity models. In Findings of the Association for Computational Linguistics: NAACL 2022, M. Carpuat, M.-C. de Marneffe, and I. V. Meza Ruiz, Eds. Association for Computational Linguistics, Seattle, United States, 353–365.
- Graesser, A. C., McNamara, D. S., Louwerse, M. M., and Cai, Z. 2004. Coh-metrix: Analysis of text on cohesion and language. Behavior Research Methods, Instruments, & Computers 36, 2, 193–202.
- Gunning, R. 1952. The Technique of Clear Writing. McGraw-Hill.
- Hertweck, F., Jonas, L., Thome, B., and Yasar, S. 2024. RWI-UNI-SUBJECTS: Complete records of all subjects across German HEIs (1971 - 1996). Tech. rep., RWI – Leibniz Institute for Economic Research.
- Hu, B., Zhu, J., Pei, Y., and Gu, X. 2025. Exploring the potential of LLM to enhance teaching plans through teaching simulation. npj Science of Learning 10, 1, 7.
- Jindal, P. and MacDermid, J. C. 2017. Assessing reading levels of health information: uses and limitations of flesch formula. Education for Health 30, 1, 84–88.
- Kahneman, D. 1973. Attention and effort. Prentice-Hall, Englewood Cliffs.
- Kleinnijenhuis, J. 1991. Newspaper complexity and the knowledge gap. European Journal of Communication 6, 4, 499–522.
- Kong, A., Zhao, S., Chen, H., Li, Q., Qin, Y., Sun, R., Zhou, X., Wang, E., and Dong, X. 2024. Better zero-shot reasoning with role-play prompting. In Proceedings of the 2024 Conference of the North American Chapter of the Association for Computational Linguistics: Human Language Technologies (Volume 1: Long Papers), K. Duh, H. Gomez, and S. Bethard, Eds. Association for Computational Linguistics, Mexico City, Mexico, 4099–4113.
- Lee, B. W. and Lee, J. 2023. Prompt-based learning for text readability assessment. In Findings of the Association for Computational Linguistics: EACL 2023, A. Vlachos and I. Augenstein, Eds. Association for Computational Linguistics, Dubrovnik, Croatia, 1819–1824.
- Lee, M., Gero, K. I., Chung, J. J. Y., Shum, S. B., Raheja, V., Shen, H., Venugopalan, S., Wambsganss, T., Zhou, D., Alghamdi, E. A., et al. 2024. A design space for intelligent and interactive writing assistants. In Proceedings of the 2024 CHI Conference on Human Factors in Computing Systems. CHI ’24. Association for Computing Machinery, New York, NY, USA, 1–35.
- Leroy, G., Helmreich, S., and Cowie, J. R. 2010. The influence of text characteristics on perceived and actual difficulty of health information. International Journal of Medical Informatics 79, 6, 438–449.
- Lundberg, S. M. and Lee, S.-I. 2017. A unified approach to interpreting model predictions. In Advances in Neural Information Processing Systems, I. Guyon, U. V. Luxburg, S. Bengio, H. Wallach, R. Fergus, S. Vishwanathan, and R. Garnett, Eds. Vol. 30. Curran Associates, Inc., Red Hook, NY, USA, 4768–4777.
- Marginson, S. 2016. The worldwide trend to high participation higher education: Dynamics of social stratification in inclusive systems. Higher Education 72, 413–434.
- Min, S., Lyu, X., Holtzman, A., Artetxe, M., Lewis, M., Hajishirzi, H., and Zettlemoyer, L. 2022. Rethinking the role of demonstrations: What makes in-context learning work? In Proceedings of the 2022 Conference on Empirical Methods in Natural Language Processing, Y. Goldberg, Z. Kozareva, and Y. Zhang, Eds. Association for Computational Linguistics, Abu Dhabi, United Arab Emirates, 11048–11064.
- Mohtaj, S., Naderi, B., and Möller, S. 2022. Overview of the GermEval 2022 shared task on text complexity assessment of German text. In Proceedings of the GermEval 2022 Workshop on Text Complexity Assessment of German Text, S. Möller, S. Mohtaj, and B. Naderi, Eds. Association for Computational Linguistics, Potsdam, Germany, 1–9.
- Mosquera, A. 2022. Tackling data drift with adversarial validation: An application for German text complexity estimation. In Proceedings of the GermEval 2022 Workshop on Text Complexity Assessment of German Text, S. Möller, S. Mohtaj, and B. Naderi, Eds. Association for Computational Linguistics, Potsdam, Germany, 39–44.
- Naderi, B., Mohtaj, S., Ensikat, K., and Möller, S. 2019. Subjective assessment of text complexity: A dataset for german language. arXiv preprint arXiv:1904.07733.
- Napolitano, D., Sheehan, K., and Mundkowsky, R. 2015. Online readability and text complexity analysis with TextEvaluator. In Proceedings of the 2015 Conference of the North American Chapter of the Association for Computational Linguistics: Demonstrations, M. Gerber, C. Havasi, and F. Lacatusu, Eds. Association for Computational Linguistics, Denver, Colorado, 96–100.
- Paetzold, G. and Specia, L. 2016. SemEval 2016 task 11: Complex word identification. In Proceedings of the 10th International Workshop on Semantic Evaluation (SemEval-2016), S. Bethard, M. Carpuat, D. Cer, D. Jurgens, P. Nakov, and T. Zesch, Eds. Association for Computational Linguistics, San Diego, California, 560–569.
- Romstadt, J., Strombach, T., and Berg, K. 2024. GraphVar – Ein Korpus für graphematische Variation (und mehr). De Gruyter, Berlin, Boston, 425–436.
- Rumelhart, D. E., Hinton, G. E., and Williams, R. J. 1986. Learning representations by back-propagating errors. nature 323, 6088, 533–536.
- Sanh, V., Debut, L., Chaumond, J., and Wolf, T. 2019. DistilBERT, a distilled version of BERT: smaller, faster, cheaper and lighter. CoRR abs/1910.01108.
- Santucci, V., Santarelli, F., Forti, L., and Spina, S. 2020. Automatic classification of text complexity. Applied Sciences 10, 20, 7285.
- Seiffe, L., Kallel, F., Möller, S., Naderi, B., and Roller, R. 2022. Subjective text complexity assessment for German. In Proceedings of the Thirteenth Language Resources and Evaluation Conference, N. Calzolari, F. Béchet, P. Blache, K. Choukri, C. Cieri, T. Declerck, S. Goggi, H. Isahara, B. Maegaard, J. Mariani, H. Mazo, J. Odijk, and S. Piperidis, Eds. European Language Resources Association, Marseille, France, 707–714.
- Shakil, H., Farooq, A., and Kalita, J. 2024. Abstractive text summarization: State of the art, challenges, and improvements. Neurocomputing 603, 128255–128255.
- Spencer, M., Gilmour, A. F., Miller, A. C., Emerson, A. M., Saha, N. M., and Cutting, L. E. 2019. Understanding the influence of text complexity and question type on reading outcomes. Reading and Writing 32, 603–637.
- Thome, B., Hertweck, F., and Conrad, S. 2024. Determining perceived text complexity: An evaluation of German sentences through student assessments. In Proceedings of the 17th International Conference on Educational Data Mining. International Educational Data Mining Society, Atlanta, Georgia, USA, 714–721.
- Tolochko, P., Song, H., and Boomgaarden, H. 2019. “That looks hard!”: Effects of objective and perceived textual complexity on factual and structural political knowledge. Political Communication 36, 4, 609–628.
- Tversky, A. and Kahneman, D. 1974. Judgment under uncertainty: Heuristics and biases: Biases in judgments reveal some heuristics of thinking under uncertainty. Science 185, 4157, 1124–1131.
- Yang, Y.-H., Chu, H.-C., and Tseng, W.-T. 2021. Text difficulty in extensive reading: Reading comprehension and reading motivation. Reading in a Foreign Language 33, 1, 78–102.
- Zheng, L., Chiang, W.-L., Sheng, Y., Zhuang, S., Wu, Z., Zhuang, Y., Lin, Z., Li, Z., Li, D., Xing, E., et al. 2023. Judging LLM-as-a-judge with MT-bench and chatbot arena. Advances in Neural Information Processing Systems 36, 46595–46623.
A. Flesch-Reading-Ease (FRE)
The Flesch-Reading-Ease (FRE) scoring system, based on Flesch (1948), shown in Table 7, categorizes texts based on their readability and the educational level required for comprehension. Scores ranging from 0 to 30 are considered very difficult and are typically suitable for academic audiences, while scores of 90 to 100 represent very easy texts, appropriate for readers at a primary school level. Intermediate scores, such as standard readability (60–70), align with texts designed for secondary school readers.
| FRE score | Readibility | Educational level |
|---|---|---|
| 0 to 30 | very difficult | academics |
| 30 to 50 | difficult | |
| 50 to 60 | fairly difficult | |
| 60 to 70 | standard | secondary school |
| 70 to 80 | fairly easy | |
| 80 to 90 | easy | |
| 90 to 100 | very easy | primary school |
B. DATA
B.1. Screenshots of the online tool

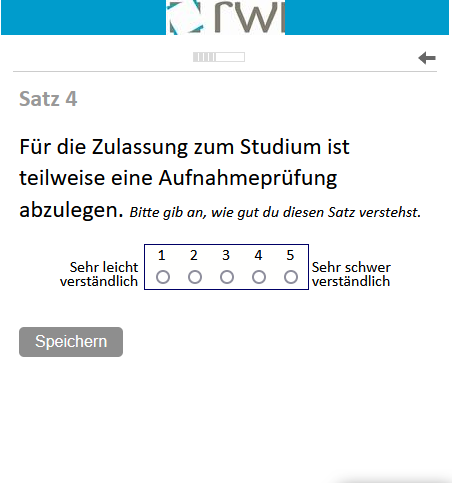
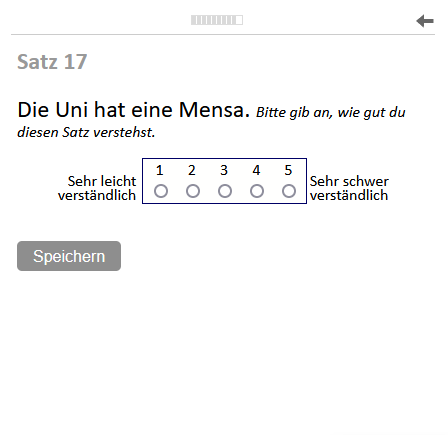
Figure 7 shows screenshots of the online tool that we have used to do the survey. The students scanned QR codes using their mobile phones and got redirected to their individual survey pages.
C. Support Vector Machine Evaluation
The radial basis function (rbf) kernel performed well in our SVM regression model (see Table 8) as it effectively captured the non-linear relationships of the several features, such as language background and school grades, which influence the perceived text complexity. Its ability to map data into a higher-dimensional space allowed for better modeling of complex interactions, leading to improved predictive performance compared to linear approaches. Note that the RMSE values reported during hyperparameter tuning differ from the final test set results, as the GridSearch was conducted using a 5-fold cross-validation on the training data. These values reflect the model’s performance variability across different training-validation splits, whereas the final evaluation is performed on a separate test set that was not used during training or validation.
| Kernel | C | Degree | Epsilon | Gamma | RMSE |
|---|---|---|---|---|---|
| linear | 0.1 | 2 | 1 | scale | 1.509 |
| poly | 0.1 | 9 | 1 | scale | 1.493 |
| sigmoid | 100 | 2 | 0.01 | scale | 1.484 |
| rbf | 10 | 2 | 1 | 0.1 | 1.429 |
D. GraphVar Evaluation
|
Model | RMSE |
Difference | |
|---|---|---|---|
| GraphVar | without GraphVar | ||
| Linear Regression (LR) | 0.965 | 0.965 | \(\pm 0.000\) |
| Support Vector Regression (SVR) | 0.866 | 0.937 | \(-0.071\) |
| XGBoost (XGB) | 0.855 | 0.855 | \(\pm 0.000\) |
| Multilayer Perceptron (MLP) | 0.836 | 0.834 | \(+0.002\) |
| K-Nearest-Neighbors (KNN) | 0.836 | 0.855 | \(-0.019\) |
| LR + XGB | 0.890 | 0.889 | \(-0.009\) |
| LR + MLP | 0.861 | 0.857 | \(+0.004\) |
| LR + SVR | 0.859 | 0.920 | \(-0.061\) |
| KNN + LR | 0.854 | 0.858 | \(-0.004\) |
| SVR + MLP | 0.836 | 0.856 | \(-0.020\) |
| KNN + SVR | 0.828 | 0.863 | \(-0.035\) |
| SVR + XGB | 0.824 | 0.871 | \(-0.047\) |
| XGB + MLP | 0.824 | 0.822 | \(+0.002\) |
| KNN + MLP | 0.824 | 0.833 | \(-0.009\) |
| KNN + XGB | 0.822 | 0.830 | \(-0.008\) |
Table 9 shows the difference between including and excluding the out-of-vocabulary feature based on the GraphVar corpus. Since most of the models achieve slightly better results when including the feature, we decided to incorporate it into our model.
1https://github.com/boshl/studentannotations
2https://pypi.org/project/language-tool-python/
3https://pypi.org/project/textstat/
4https://pypi.org/project/krippendorff/
5https://huggingface.co/google-bert/bert-base-german-cased
6https://huggingface.co/distilbert/distilbert-base-german-cased
7https://huggingface.co/
8https://chat.openai.com/
9https://claude.ai