A Large-Scale Data Analysis
Abstract
Combining formative practice with the primary expository content in a learning by doing method is a proven approach to increase student learning. Artificial intelligence has led the way for automatic question generation (AQG) systems that can generate volumes of formative practice otherwise prohibitive to create with human effort. One such AQG system was developed that used textbooks as the corpus of generation for the sole purpose of generating formative practice to place alongside the textbook content for students to use as a study tool. In this work, we analyzed a data set comprising over 5.2 million student-question interaction sessions. More than 800,000 unique questions were answered across more than 9,000 textbooks, with over 400,000 students using them. As part of the user experience, students could rate questions after answering with a social media-style thumbs up or thumbs down. In this investigation, this student feedback data was used to gain new insights into the automatically generated questions: are there features of questions that influence student ratings? An explanatory model was developed to analyze ten key features that may influence student ratings. Results and implications for improving automatic question generation are discussed. The code and data for this paper are available at https://github.com/vitalsource/data.
Keywords
Introduction
A significant advantage of digital learning environments is the ability to perform data-driven evaluation of those environments. The generation of large quantities of high-quality data enables learning analytics and educational data mining (Goldstein & Katz, 2005), which has also spurred a wider set of methods to distill meaning from this data (Baker & Inventado, 2016; Reardon & Stuart, 2019). Fischer et al. (2020) identify levels of data, with the clickstream data collected by learning platforms (such as the one in this paper) categorized as microlevel big data. While it is true that “digital traces of student actions promise a more scalable and finer-grained understanding of learning processes” (Fischer et al., 2020), this data is also useful for analyzing the learning environment and tools themselves (Van Campenhout, Jerome, & Johnson, 2023a). As artificial intelligence continues to broaden student access to evidence-based learning methods (such as formative practice), novel data sets are essential for evaluating these tools and improving them. In this paper, the microlevel clickstream data is combined with syntactic and semantic data derived from natural language processing and student perception feedback gathered in the form of thumbs up/down ratings. McFarland et al. (2021) note that new methods using novel data will be applied to solve educational challenges, allowing for old research questions to be answered in new ways and new research questions to arise from novel data and new techniques. The goal of this paper is to do just that—use a novel data set gathered from a digital platform to investigate the relationship of student rating data with features of automatically generated questions. This research is based on the largest known data set of student feedback on automatically generated (AG) questions to date, consisting of over 5.2 million interaction sessions across diverse learning contexts. To enable replication and extension of this work, the data set is made available in our open-source data repository (VitalSource, 2024). This paper includes an expansion of the analysis done in Johnson et al. (2024) to include new visualizations, an analysis of student ratings by subject, and an estimation of how tuning the AQG model could impact ratings.
Formative practice has long been known to be a beneficial learning method, shown to increase learning gains for a wide range of age groups in diverse subjects and, while benefiting all students, can benefit low-performing students more (Black & Wiliam, 2010). The integration of formative practice with content provides low- or no-stakes practice testing, a high utility learning approach (Dunlosky et al., 2013). The new data produced by inclusion of formative practice in digital learning environments in this learning by doing approach enables investigation of the benefits of learning by doing in novel ways. Koedinger et al. (2015; 2016) used data from the Open Learning Initiative’s courseware environment to apply learning analytic techniques showing both correlational and causal relationships between doing practice while reading and increased learning outcomes. Called the doer effect, novel data and analytics were used to prove the relationship between this learning method and learning outcomes. In an effort to scale the doer effect benefits to as many students as possible, we have worked to replicate it in similar courseware used across many subjects at a different institution (Van Campenhout, Jerome, & Johnson, 2023b; Van Campenhout, Johnson, & Olsen, 2021; 2022).
Automatic question generation (AQG) for the creation of formative practice became attainable with the advancements in natural language processing and machine learning tools in recent years. AQG systems have been developed for a wide variety of educational applications, yet notably, the systematic review of literature by Kurdi et al. (2020) found only one AQG system using student data for analysis and call for AQG research to increase question evaluation with student data. Similarly focusing on AQG methods, Zhang et al. (2021) provide a taxonomy of AQG methods, categorizing technical advances from rule-based to neural network models. They similarly note that AQG evaluation is largely done by human review—a subjective and non-scalable approach—and state, “More research efforts are needed to construct standard benchmark datasets and evaluation tasks to facilitate research and rigorous comparison” (p. 14:32). Das et al. (2021) highlight the importance of question quality and learner engagement in AQG, reviewing diverse question types and the metrics used for assessing effectiveness. While Das et al. emphasize quality metrics and engagement, their review lacks an emphasis on large-scale student interaction data sets. Mulla and Gharpure (2023) discuss AQG systems across categories, focusing extensively on methods for generation and stressing educational relevance but noting the lack of studies using large-scale interaction data. They specifically conclude that, “Another area of working towards this field is building some metrics for a thorough evaluation of the generated questions” (p. 24). The trend from these recent AQG reviews makes it clear that the field of AQG has produced prolific and diverse methods of generation for varying applications, but the evaluation of these systems requires more research in general, and in particular there is a lack of research using student data from natural learning contexts.
The AQG system that is the subject of this paper has generated formative practice that has been used by students as part of their university courses. First deployed in courseware learning environments, the automatically generated questions were intermixed with human-authored questions, and student usage data provided a data set of 786,242 student-question interactions for analysis (Van Campenhout et al., 2021b). This initial research found that students did not treat questions differently depending on whether they were automatically generated versus human authored, but rather according to the cognitive process dimension of the question type (recognition or recall). This research provided initial performance metric benchmarks for engagement, difficulty, persistence, and discrimination of these AG questions (Johnson et al., 2022; Van Campenhout, et al., 2021b). The large volume of student data collected by the platform was key to validating the AG questions. The AG questions deployed in courseware were further studied in a psychology course at a major public university. Students in the course perceived the questions as beneficial for their learning (Van Campenhout, Hubertz, & Johnson, 2022) and a comparison of exam scores found that doing the formative practice correlated to increased exam scores (Hubertz & Van Campenhout, 2023).
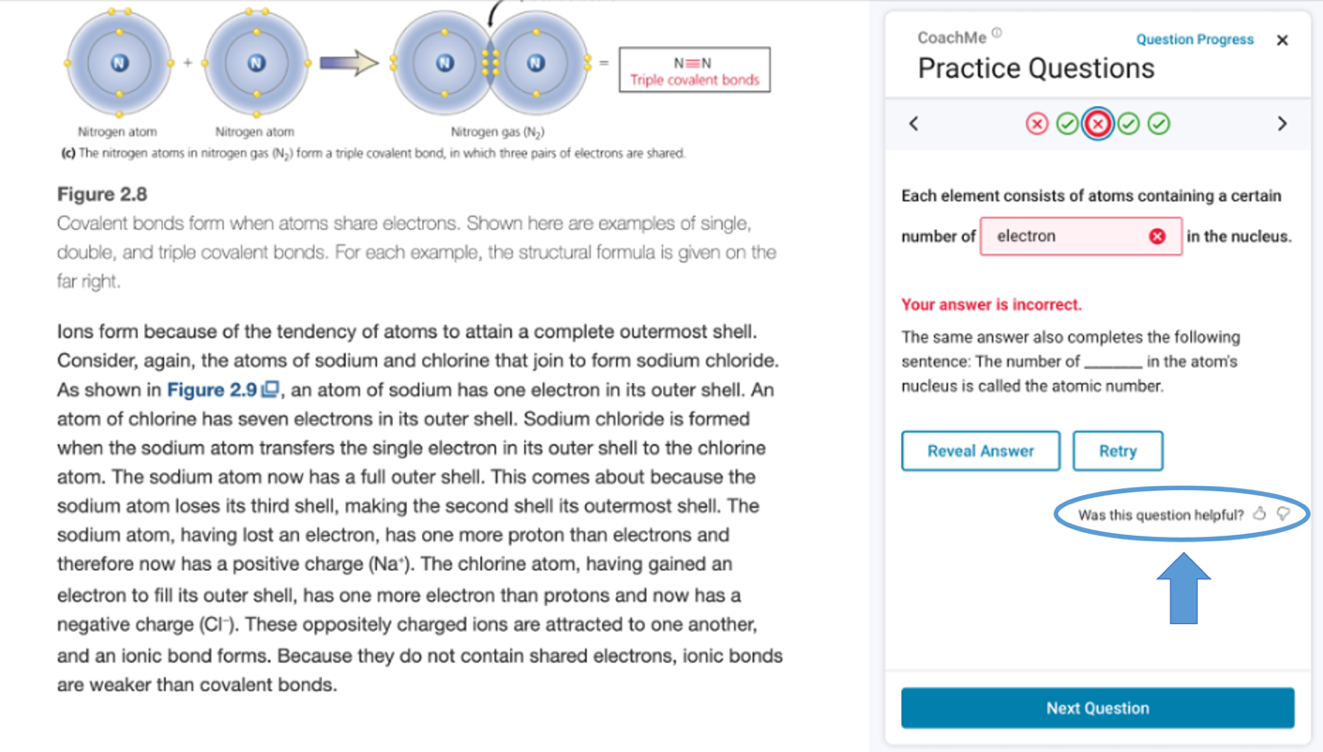
To further scale the availability of formative practice, approximately 2.5 million AG questions were then added to more than nine thousand online textbooks in the VitalSource Bookshelf ereader platform as a free study feature called CoachMe, launched in January 2022 and available to millions of students (Van Campenhout et al., 2023b). This practice feature contains several types of AG questions, including fill-in-the-blank (FITB), matching, multiple choice, and free response. The FITB questions, which comprise the majority of the AG questions, are the focus of the present study. As shown in Figure 1, the questions open in a panel next to the textbook content, allowing students to refer back to the content if needed while they answer. As formative practice, students are allowed as many attempts to answer as they like, receive immediate feedback, and can also reveal the answer if stuck.
An analysis of 7,077,271 student interactions with the AG questions deployed in CoachMe revealed similar results for difficulty and persistence performance metrics (Van Campenhout et al., 2023b) as prior research (Van Campenhout et al., 2021b). Results showed similar differences in performance benchmarks between recognition and recall questions, however, a comparative evaluation of questions answered from a single university course revealed higher difficulty index values and persistence rates, suggesting that students answered differently in this classroom context than in the large aggregated data set (Van Campenhout et al., 2023b). Follow-up research focused on 19 sections of courses at a major public university where faculty assigned the AG questions as homework, and analysis of performance metrics showed higher difficulty means and persistence rates across all courses (Van Campenhout et al., 2024a). These studies that utilize student data from natural learning contexts to evaluate the performance of AG questions on key metrics establish benchmarks missing from the literature, as noted by the recent AQG systematic reviews.
The volume of clickstream data gathered by the ereader platform was also useful for investigating student behavior in detail. As seen in Figure 1, when students answer a question incorrectly, they can reveal the answer or retry on their own. An analysis of student behavior patterns for each type of AG question found differences by question type, with even more differences in student behaviors when comparing the aggregated data set to a course where the practice was assigned (Van Campenhout et al., 2023a).
Also shown in Figure 1 is an option for students to rate the question (“Was this question helpful?”) with a thumbs up or thumbs down. Once rated, students can offer additional written feedback. The student rating data is one stream of data used in the Content Improvement Service (CIS)—a platform-level adaptive system that monitors all AG questions in all textbooks in real time (Jerome et al., 2022). In an analysis of data used by the CIS to make decisions, about 2.2% of all questions were rated (up or down), and of that 2.2%, only 2.4% had more than one thumbs down and were thus slated for removal (Jerome et al., 2023). Investigating those questions removed by the CIS for multiple thumbs down ratings revealed trends across question types and features of FITB questions, such as the answer’s part of speech and position in the sentence.
However, beyond the CIS’s focus on the evaluation, removal, and replacement of questions, student rating data presents a novel way to more broadly evaluate features of questions. Combining this student rating data with clickstream data and features of questions (including syntactic and semantic data determined by natural language processing) creates a novel data set that can help identify relationships between student ratings and AG question features. In this investigation, an explanatory regression model is used to explore these relationships. Considering this data set, our overarching research question is: what relationships do the explanatory model suggest between student ratings and AG question features? This research question is investigated through a set of specific hypotheses that drive the creation of the explanatory model, as detailed in the Methods section.
Before proceeding, it is important to note that while this study does not measure learning outcomes, the focus on student affective perceptions is both valuable and necessary. Research has consistently shown that positive student perceptions, such as increased satisfaction and reduced frustration, are strongly correlated with enhanced engagement, motivation, and persistence in learning tasks (Gray & DiLoreto, 2016; Shute, 2008). These factors, in turn, support long-term learning outcomes. The success of educational tools in real-world settings depends heavily on their acceptability and usability, as tools that are disliked or poorly received by students are unlikely to achieve their intended impact, regardless of their potential learning benefits.
In addition to enhancing student affective perceptions, understanding the causal links between question features and student ratings is essential for improving the quality of AQG systems. A thumbs down rating often reflects underlying issues with a question, such as lack of clarity, irrelevance, or poor alignment with the subject matter. Identifying causal relationships between question features and these ratings enables systematic refinement of the AQG process, reducing the likelihood of generating substandard questions. This dual focus—improving student satisfaction and using ratings to inform AQG design—ensures that the system evolves to produce higher-quality, pedagogically sound questions. As student satisfaction is both an outcome and a driver of tool adoption, this study contributes actionable insights for iterative improvements in AQG systems that align with educational objectives.
This study is complementary to prior studies on automatic question generation in two ways. First, as mentioned earlier, previous research comparing AG and human-authored questions has shown that AG questions can perform on par with human-authored ones on several measures (Johnson et al., 2022; Van Campenhout et al., 2021b). The same validated approach was used to generate the questions in this work, ensuring that the AQG method is consistent with those earlier findings. Second, recent research indicates AG questions also support improved learning outcomes by producing the doer effect, where formative practice with AG questions leads to measurable learning gains (Hubertz & Van Campenhout, 2023; Van Campenhout et al., 2024a; Van Campenhout, Hubertz, & Johnson, 2022; Van Campenhout et al., 2025).
We therefore present a unique exploration of one of the largest collections of student interactions with AG questions to date. In addition to addressing gaps in the AQG literature, this study contributes a data set of very large scale, with over 5.2 million student-question sessions. By making this data set and analysis code openly available (VitalSource, 2024), the study not only advances understanding of AG question features and student ratings but also provides a valuable resource for future research in educational data mining and automatic question generation.
Methods
Automatic Question Generation
We provide a concise description of the essential features of the AQG methodology used to generate the questions in this study, following the recommendations of Kurdi et al. (2020) by answering the questions provided in OBJ2 of their paper (p. 126). These provide a standardized framework for documenting AQG systems, ensuring clarity and consistency in reporting methods across studies. While the AQG system is not the focus of this research, by aligning with Kurdi’s framework we follow best practices for transparency and facilitate comparisons with other AQG systems in the literature.
The questions in this study are FITB cloze questions created from important sentences in the textbook content. The purpose of AQG in this study is to generate questions for formative practice as students read a textbook. The textbook that students are using is the input corpus. The NLP analyses are carried out using the spaCy library (Honnibal, et al., 2020) with the CPU-optimized large model (en_core_web_lg). Generation uses both syntactic and semantic levels of understanding. This information is used to accomplish two primary tasks: selecting the content sentences for the questions and selecting the term to be used as the answer. Syntactic information, such as part-of-speech tagging and dependency parsing, is used in both sentence selection and answer term selection. Semantic knowledge is also used for detecting important content. A rule-based expert system approach is used for the procedure of transformation.
For important sentence identification, the textbook corpus is divided into sections of up to approximately 1,500 words, based on major textbook sections such as chapters and their major headings, subdividing these when exceeding 1,500 words. The sentences in each section are then ranked with the TextRank algorithm (Mihalcea & Tarau, 2004), with the higher-ranking sentences used for AQG. TextRank uses sentence vector embeddings to compute their similarities, with the outcomes depending on the details of the embedding method. The spaCy model used provides pretrained word embeddings designed for general NLP tasks, creating sentence embedding vectors by averaging the vectors of its constituent tokens. Our AQG system removes stop words and tokens without an alphabetic character (e.g., punctuation, numbers) before embedding. Very short (< 5 words) and very long (> 40 words) sentences are also removed from consideration, as these are less likely to be suitable for questions. TextRank is then performed on the qualifying sentences in each textbook corpus section.
The other major component of cloze question generation is selection of the answer word within each selected sentence, which is done by applying a series of rules. The rules were developed by the AQG system’s developers, leveraging prior experience in creating rule-based intelligent tutoring systems. The selection process initially designates every word in the sentence as an answer candidate. Each candidate then undergoes a series of filtering steps, represented by the following rules.
Words that are stop words or function words, such as articles and prepositions, are excluded.
Words within parenthetical expressions are excluded.
Words that appear multiple times within the same sentence are excluded.
Words that appear in a list connected by a conjunction are excluded.
Common textbook-specific words (e.g., “chapter”) are excluded.
Words that occur less than a threshold number of times in the corpus are excluded.
Words that occur in a high percentage of corpus pages are excluded.
If any words in the sentence appear in the textbook’s glossary, words that do not appear in the glossary are excluded.
Words whose probability of occurrence in the corpus does not surpass their baseline usage frequency in the language by a specified threshold are excluded.
Words having a synonym that also occurs in the corpus (Fellbaum, 2010) are excluded.
Words that are highly predictable given the other words in the sentence based on a textual cooccurrence model (Evert, 2009) are excluded.
Words with substantially lower total pointwise mutual information (Evert, 2009) than another word in the sentence are excluded.
Thresholds required for certain rules were determined empirically through iterative testing and refinement. It was found that setting these thresholds to “reasonable” levels, such as requiring at least 20 total occurrences in the corpus, captured most of the benefit in filtering out overly rare or unimportant words without an exhaustive parameter search. Similarly, for filtering by baseline usage frequency, each candidate’s log probability is obtained from spaCy’s pretrained model, and a modest threshold (2.0 on the log scale) is applied to favor domain-specific terms. If all candidates are eliminated after applying the rules, no question is generated from the sentence. When multiple answer candidates remain, a separate question is generated for each candidate.
This overarching philosophy prioritizes generating higher-quality questions over maximizing the number of questions created. By systematically filtering out words that are too common, predictable, or contextually irrelevant, and favoring terms that are important within the textbook's subject matter, the process aims to ensure that the generated blanks highlight key concepts while avoiding trivial or ambiguous selections. There is no attempt to control difficulty of the questions during generation, but difficulty is monitored using student data after deployment, with questions deemed to have undesirably high difficulty for formative practice automatically removed and replaced (Jerome et al., 2022; 2023). While the AQG method employed is not designed for a specific domain and is applicable to a wide variety of subject matter, it is not applicable for some domains such as mathematics and language learning given the different styles of practice for learning in those subjects.
Outcome feedback (right/wrong) is always available after students answer questions. In most cases, additional feedback is generated using textbook sentences related to the question stem (Van Campenhout et al., 2024b), such as a different sentence containing the same answer word (illustrated in Figure 1), or additional sentences adjacent to the question sentence to provide context (examples in Figure 3). Verbalization like paraphrasing is deliberately avoided in feedback to eliminate the possibility of introducing terminology that is inconsistent with the textbook the questions accompany.
Mulla and Gharpure (2023) note that, “The eventual goal of AQG systems is the capability to generate questions that are correct syntactically and semantically as well as meaningful in the context of the use-case” (p. 1). The AQG method employed in this study was designed with these goals in mind, ensuring syntactic correctness and targeting the most relevant content in sentence and key term selection processes. Years of design and validation have informed the development of this system, enabling it to focus on reinforcing the most important textbook content while excluding material unsuitable for the AQG method, such as examples and end-of-chapter material. Despite these efforts, it is not possible to detect and exclude certain content undesirable for question generation with complete accuracy. Moreover, as Mulla and Gharpure note, “generating meaningful questions is a challenge as most existing techniques focus more on the syntactical aspects rather than information extracting questions” (p. 21). This underscores the important role of leveraging student ratings to assess and refine AQG outputs, ensuring alignment with educational goals. To address this limitation, student ratings became an integral component of our Content Improvement Service, enabling the identification and removal of poorly performing questions in real time (Jerome et al., 2022). In practice, there are approximately two thumbs down ratings per 1,000 questions answered, with 0.068% (~1 in 1,500) of FITB questions ultimately removed for receiving more than one thumbs down rating (Jerome et al., 2023), so the system does demonstrate a high baseline for generating meaningful questions.
Before proceeding, we note that the recent surge in interest in AQG using large language models (LLMs) introduces new opportunities and challenges. The AQG system in this work predates the emergence of these advanced LLMs, which gained significant traction following the release of ChatGPT in late 2022. While LLMs hold tremendous potential and will undoubtedly contribute significant advancements to AQG, their application in educational contexts is nascent. Key challenges include mitigating issues such as “hallucination,” where factually inaccurate content is generated. By contrast, the current AQG system ensures factual accuracy by generating questions directly from textbook sentences. This constraint was a deliberate design choice to maintain the integrity of educational content. Although the present study does not employ LLMs, their integration alongside rule-based systems is currently being actively explored, e.g., Dittel et al. (2024), to balance innovation with the reliability required for large-scale educational deployments in future iterations of our AQG system.
Modeling of Student Ratings
The data set for this study is comprised of student-question interaction events for FITB questions from January 1, 2022 to January 16, 2024. The ereader platform collects all student interactions and stores the raw clickstream data with an anonymous numeric identifier. Student consent for data to be used for research and analytics purposes is given by acceptance of the platform’s terms of use and privacy policy. No student characteristics are collected and the learner context is not known, though the majority of data comes from higher education institutions in the United States. Data was grouped into student-question sessions, consisting of all actions of an individual student on an individual question ordered chronologically. Sessions in which more than ten minutes had elapsed between the student’s first and last action were removed (1.4% of the data) to account for the possibility of the student leaving the textbook and returning, potentially affecting rating behavior.
This resulted in a data set of 5,214,211 sessions comprising 9,206,369 interaction events, involving 809,848 AG questions, 432,930 students, and 9,320 textbooks. Using the standard BISAC major subject heading classification (Book Industry Study Group, 2022) available for most of the textbooks, the top subject domains as a fraction of the sessions data set were Medical (16.0%), Business & Economics (15.3%), and Psychology (13.9%). The scale and richness of the data set are a direct result of using an established AQG framework capable of large-scale deployment during a two-year data collection period, representing an unprecedented opportunity to study AG questions in real-world learning contexts. While recent advances in AQG methods, particularly the use of large language models, offer many exciting future possibilities, they have not yet been deployed at a scale capable of generating comparable data. This study therefore helps address a key gap in the literature by providing insights into the relationships between AG question features and student perceptions that were not previously attainable.
In this work, we employ an explanatory modeling approach to understand factors that influence whether a student rates a question positively (thumbs up) or negatively (thumbs down). Explanatory modeling differs from predictive modeling in its focus. While the primary goal for predictive models is to optimize variables for accurate outcome predictions, with little concern for understanding the underlying causal mechanisms (Sainani, 2014), explanatory models are designed to identify variables that are causally related to an outcome. Explanatory modeling is a well-established technique used across scientific disciplines, including in social and behavioral sciences, where causal mechanisms are of interest but experimental controls are often impractical. In this framework, variable selection is driven by specific hypotheses about how each variable may influence the outcome of interest, and statistical models are applied to test these hypotheses. Shmueli (2010) emphasizes that, although explanatory models are often based on observational data, they provide valuable insights into causal relationships through hypothesis-driven variable selection. Although experimental studies are the gold standard for establishing causation, explanatory models provide insights that extend beyond mere correlations (Shmueli, 2010). This is particularly relevant for educational data, where understanding the “why” behind student behaviors can guide practical improvements in educational tools (Alshehri, 2019).
Koedinger et al. (2016) also argue that analysis of data from natural learning contexts provides stronger external validity and generalizability compared to randomized controlled experiments, which often focus on narrow contexts or single interventions. By leveraging large-scale data from naturally occurring variations in online learning environments, educational interventions can be evaluated across diverse contexts and student populations at lower cost with broader ecological validity.
To build an explanatory model, we hypothesize that specific AG question features affect student ratings due to cognitive and perceptual factors that impact students’ experiences with the questions. For example, it can be hypothesized that as a question’s answer word becomes more important to the subject matter (e.g., “chromosome” vs. “cell” in a biology chapter on cell structure), students will be more likely to rate the question positively. Explanatory variables can also relate to other aspects of the student’s experience during the practice session that are not entirely intrinsic to the question itself. For example, when the student’s answer appears to be a misspelling of the correct answer, the system gives a Google-like “Did you mean ______?” suggestion (Figure 2). In sessions where a spelling correction suggestion was given, there were fewer thumbs down ratings. Such variables are included not only for explanatory purposes but also to control for them when assessing the effects of variables intrinsic to AQG.
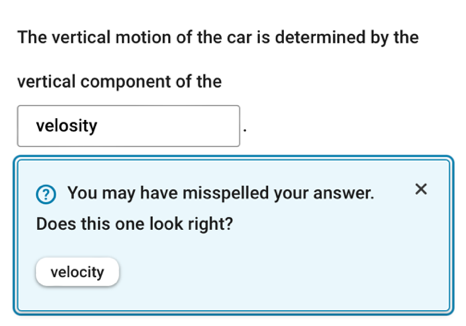
Table 1 gives ten hypotheses about causal relationships affecting student rating behavior investigated in this work. These hypotheses are linked to theoretical principles from educational psychology, linguistics, and user experience research.
Hypotheses H1-H5 are relatively intuitive. For example, self-efficacy theory posits that successful task completion increases motivation and positive perception (Bandura, 1977). When students answer correctly, they likely experience a sense of competence and mastery, making them more inclined to rate the question positively (H1). And, according to schema theory (Anderson, 2018), comprehension is facilitated when content aligns with learners’ mental frameworks or prior knowledge structures. Questions that are derived from key textbook content likely resonate better with students’ schemas, making these questions feel more relevant and valuable, leading to higher satisfaction and positive ratings (H4 and H5).
Hypotheses H6-H10 warrant elaboration. For H6, linguistic research indicates that nouns and adjectives often convey more semantic weight and content-specific meaning than verbs and adverbs (Givón, 2001). In educational contexts, nouns and adjectives frequently represent key concepts or terminologies (e.g., textbook glossaries and indexes consist primarily of nouns and noun phrases), and so these might generally be perceived as more pertinent and pedagogically valuable than other parts of speech.
The rationale for H7 is the distinctiveness effect in cognitive psychology, which states that unusual or uncommon items are more likely to attract attention and be perceived as significant (Hunt & Worthen, 2006). Rarer words, often technical terms or jargon specific to the textbook’s subject domain, can enhance perceived pedagogical relevance by drawing attention to key concepts that may not be encountered frequently outside of the academic setting.
|
Code |
Hypothesis |
|---|---|
|
H1 |
Answering a question correctly on the first attempt will increase the chance of a thumbs up and decrease the chance of a thumbs down. |
|
H2 |
As a student answers more questions, the chance of giving a rating (thumbs up or down) will decrease. |
|
H3 |
Receiving a spelling correction suggestion for an answer will increase the chance of a thumbs up and decrease the chance of a thumbs down. |
|
H4 |
Questions created from more important sentences in the textbook will receive more thumbs up and fewer thumbs down. |
|
H5 |
Questions with answer words that are more important in the textbook will receive more thumbs up and fewer thumbs down. |
|
H6 |
Questions with noun and adjective answer words will receive more thumbs up and fewer thumbs down than verb and adverb answer words. |
|
H7 |
Questions with rarer words as the answer will receive more thumbs up and fewer thumbs down than questions with more common words as the answer. |
|
H8 |
Questions where the answer blank occurs early in the sentence will receive fewer thumbs up and more thumbs down. |
|
H9 |
Questions that give elaborative feedback after an incorrect answer will receive more thumbs up and fewer thumbs down than questions that give only outcome feedback. |
|
H10 |
Questions that have been reviewed by a human reviewer before inclusion will receive more thumbs up and fewer thumbs down than questions that did not have human review. |
For H8, it has previously been observed that thumbs down are more common when the answer blank occurs in the first few words of the sentence (Jerome et al., 2023). This is supported by cognitive load theory (Sweller, 1988). When the blank is early in the sentence, students have less contextual information to work with, increasing cognitive load and making it
harder to deduce the correct answer. Such questions may feel more challenging or ambiguous, leading to a perception that the question is less helpful and to a higher likelihood of a negative rating. By contrast, when a blank occurs late in the sentence, most or all of the information needed for prediction has already been read before the blank is encountered.
H9 concerns two types of elaborative feedback (called context feedback and common answer feedback, Figure 3), that are automatically generated with the question where possible to be given after an incorrect answer. When neither type of AG feedback can be generated, simple outcome (right/wrong) feedback is given. Elaborative feedback has been shown to be effective in general (Shute, 2008), and both AG feedback types have been shown to be more effective than outcome feedback in increasing the number of student second attempts as well as correctness on the second attempt (Van Campenhout et al., 2024b); it is thus hypothesized that the AG feedback will contribute to increased student satisfaction. For details on the AG feedback types, see Van Campenhout et al. (2024b).
For H10, early in the CoachMe launch the AG questions included a human review pass by the AQG development team to check for common AQG quality issues that are not subject-matter related and do not require pedagogical expertise, such as errors with text extraction from the textbook and unresolved anaphoric references in the question stem. The manual review step was eliminated as scale increased due to the time and cost involved. However, quality assurance theory and user experience research (Nielsen, 1994) suggest that human review helps reduce errors and refine content to meet user expectations. Questions that have been reviewed are more likely to be clear, relevant, and error-free, improving the user experience and increasing positive ratings.

Regression models applied to observational data are commonly used in explanatory modeling (Shmueli, 2010). Each hypothesis motivates a model variable that is intended to measure that relationship in the observed session data. These variable definitions are given in Table 2. Logistic regression is used to model the probability of whether a student will rate a question either thumbs up or thumbs down as a function of the explanatory variables.
|
Variable |
Type |
Definition |
|---|---|---|
|
H1_first_correct |
categorical |
1 if student’s first answer is correct, 0 if not |
|
H2_cumulative_answered |
integer |
Total number of questions answered by the student as of the session |
|
H3_spelling_suggestion |
categorical |
1 if student received a spelling suggestion during the session, 0 if not |
|
H4_sentence_textrank_rank |
continuous |
0 (most important) to 1 (least important) rank of sentence in textbook chapter |
|
H5_answer_tf_idf_rank |
continuous |
0 (most important) to 1 (least important) rank of answer word in textbook chapter |
|
H6_answer_pos |
categorical |
ADJ, ADV, NOUN, PROPN, VERB |
|
H7_answer_log_probability |
continuous |
Log probability estimate of answer word frequency |
|
H8_answer_location |
integer |
Location of answer blank in sentence, starting at 0 for first word |
|
H9_feedback |
categorical |
common_answer, context, outcome |
|
H10_reviewed |
categorical |
1 if question was manually reviewed, 0 if not |
To test H5, which posits that questions with answer words of greater importance will receive better ratings, we used the term frequency-inverse document frequency (tf-idf) score of each answer word within its textbook chapter as a measure of its importance. It should be noted that this variable is not a feature used in the AQG process itself; instead, it was computed during analysis to evaluate the relationship between word importance and student ratings. Chapter-level tf-idf was used to account for terms that may be significant in one chapter but less relevant elsewhere. This localized measure provides a finer-grained perspective on answer word importance, aligning more closely with the context in which the questions were generated and rated. Similarly, the location of the answer in the sentence (H8) is not currently a feature used during the AQG process. If these variables are shown to significantly impact ratings, they could be incorporated into the AQG system to enhance question quality and reduce negative perceptions (Section 4.1).
An important characteristic of the data set is that each student typically engaged with multiple practice questions, and similarly, each question was often answered by multiple students. The observations are not independent within these same-question and same-student clusters, which does not satisfy the assumptions of logistic regression. Such lack of independence is often addressed using a mixed effects regression model. Mixed effects models are valuable tools for analyzing clustered data, as they account for variance at multiple levels. For example, in work on regression modeling of question engagement, difficulty, and persistence (Van Campenhout et al., 2021a; 2021b), mixed effects logistic regression models were used with a random intercept per question and per student.
However, mixed effects models are generally much more computationally expensive to fit than ordinary fixed effects models. The data set in this work is much larger than those in our prior work, and in particular was too large to run mixed effects regression with random intercepts for both questions and students with the modeling software used. It was therefore necessary to assess whether a model including random intercepts for both question and student appeared critical to obtaining accurate results.
The key concern when omitting a random effect is that the violation of the independence assumption can lead to underestimated standard errors and thus incorrect p values. Importantly though, the regression coefficients themselves remain unbiased provided that the model is correctly specified (Liang & Zeger, 1993). We assert that the model is reasonably well-specified based on theoretical and methodological considerations. The explanatory variables were selected based on well-supported hypotheses derived from prior research and, while no model can include every possible variable, controls for session-level factors are included to account for potential confounding variables.
The large size of the data set (over 5.2 million observations) also strengthens the reliability of the estimated coefficients, as large samples reduce variance and improve the stability of regression estimates. While the omission of a random effect may lead to underestimation of standard errors, the large volume of data increases confidence that the coefficients are consistent with the true relationships in the population. Given the size and breadth of the data set, the observed effects are more likely to reflect meaningful patterns in student rating behavior, even in the presence of these statistical limitations.
To address these concerns to the extent practically possible, two alternative models were explored and their results compared to each other: one with random intercepts for questions but not students, and one with random intercepts for students but not questions Fitting models with random intercepts for questions and students separately helped to assess whether excluding one random effect substantially impacted the fixed-effect estimates. While the inability to include random intercepts for both questions and students simultaneously represents a limitation, it will be seen in the Results section that the consistency of regression coefficients across alternative models suggests that the core relationships identified are robust and unbiased.
All regressions were performed using R version 4.4.1 (R Core Team, 2021), with package glmmTMB version 1.1.9 (Brooks et al., 2017) for mixed effects models. The R formula for the thumbs down explanatory model, illustrated for question random intercepts, is:
glmmTMB(thumbs_down ~ H1_first_correct
+ H2_cumulative_answered
+ H3_spelling_suggestion
+ H4_sentence_textrank_rank
+ H5_answer_tf_idf_rank + H6_answer_pos
+ H7_answer_log_probability
+ H8_answer_location
+ H9_feedback + H10_reviewed
+ (1|question_id),
family=binomial(link=logit), data=sessions)
This shows that a mixed effects logistic regression model is fit using the glmmTMB function. The regression formula shows the outcome of whether a question was rated thumbs down modeled as a function of the ten explanatory variables (Table 2) with a random intercept per question to address lack of independence of question observations.
Results
Between the dates specified for data collection in the Methods section, there were a total of 5,214,211 student-question sessions included in the final data set. Each session creates a rating opportunity. Ratings were given in a total of 27,719 sessions, 17,285 with thumbs up and 10,434 with thumbs down, a rate of 3.31 thumbs up and 2.00 thumbs down per 1,000 sessions. Of the 432,930 students, 15,111 (3.49%) used the rating feature, and of the 809,848 questions, 22,844 (2.82%) were rated (either thumbs up or thumbs down).
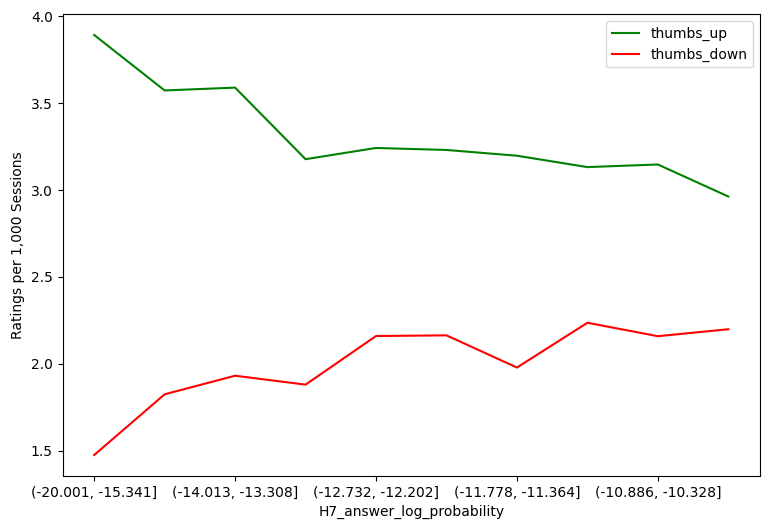
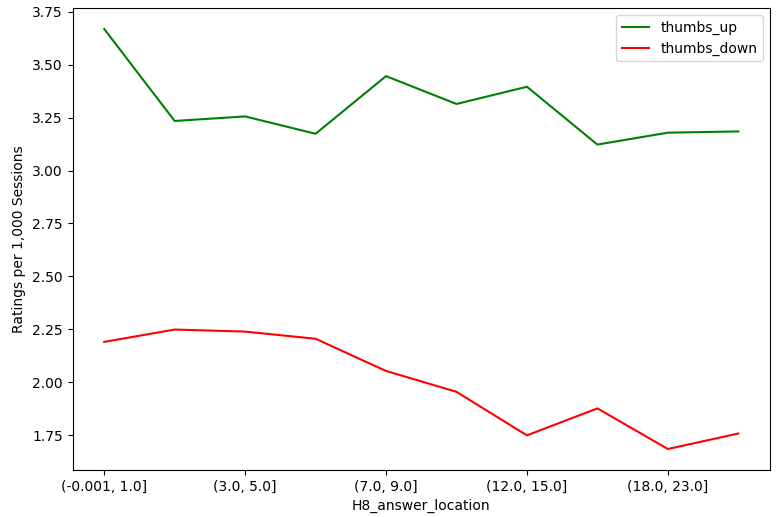
As an exploratory data analysis preliminary to model building, Table 3 shows ratings per 1,000 sessions for the individual levels of the categorical explanatory variables. Differences across variable levels are evident, indicating that many of these variables are expected to be significant in the explanatory model given the numbers of observations involved. Table 3 shows that the thumbs down rate is more sensitive to the explanatory variables than the thumbs up rate. The variation across categorical variable levels expressed as percentage difference (range divided by average) is 27%–118% for thumbs down versus 5%–22% for thumbs up. Figure 4 shows the analogous trends for the quantitative explanatory variables, similarly showing that the thumbs down rate is generally more sensitive.
|
Variable |
Level |
Sessions |
Thumbs Up |
Thumbs Down |
|---|---|---|---|---|
|
H1_first_correct |
0 |
2,292,927 |
2.91 |
3.04 |
|
1 |
2,921,284 |
3.64 |
1.19 |
|
|
H3_spelling_suggestion |
0 |
4,926,209 |
3.30 |
2.05 |
|
1 |
288,002 |
3.59 |
1.12 |
|
|
H6_answer_pos |
ADJ |
1,509,164 |
3.38 |
1.76 |
|
ADV |
52,541 |
2.70 |
5.23 |
|
|
NOUN |
3,207,347 |
3.35 |
1.96 |
|
|
PROPN |
247,666 |
3.01 |
2.23 |
|
|
VERB |
197,493 |
2.86 |
3.43 |
|
|
H9_feedback |
common_answer |
3,299,873 |
3.28 |
1.68 |
|
context |
477,814 |
3.45 |
2.55 |
|
|
outcome |
1,436,524 |
3.35 |
2.55 |
|
|
H10_reviewed |
0 |
4,915,386 |
3.34 |
2.03 |
|
1 |
298,825 |
2.86 |
1.54 |

Furthermore, since ratings are optional for student users and thumbs down ratings indicate student dissatisfaction, as a practical concern we consider reducing thumbs down ratings more important than increasing thumbs up ratings. We therefore present the thumbs down regression models first, shown in Tables 4a and 4b, while the thumbs up models are in Tables 5a and 5b. Odds ratios (obtained by exponentiating the regression coefficients) are a common measure of effect size in logistic regression, providing an intuitive interpretation of the strength and direction of the relationship. Tables 4a–5b report odds ratios for the significant effects and characterize the effect size from very small (VS) to large (L) as described in Cohen (1988).
|
Variable |
Estimate |
Std. Error |
p |
Odds Ratio |
|---|---|---|---|---|
|
H1_first_correct |
-0.822 |
0.0262 |
< 2e-16 *** |
0.439 S |
|
H2_cumulative_answered |
-0.00591 |
0.000345 |
< 2e-16 *** |
0.994 VS |
|
H3_spelling_suggestion |
-0.466 |
0.0658 |
1.32e-12 *** |
0.627 S |
|
H4_sentence_textrank_rank |
0.866 |
0.144 |
2.03e-09 *** |
2.38 S |
|
H5_answer_tf_idf_rank |
0.492 |
0.128 |
1.19e-04 *** |
1.64 S |
|
H6_answer_pos:ADV |
0.890 |
0.200 |
8.57e-06 *** |
2.44 S |
|
H6_answer_pos:NOUN |
0.150 |
0.0650 |
2.11e-02 * |
1.16 VS |
|
H6_answer_pos:PROPN |
0.484 |
0.132 |
2.39e-04 *** |
1.62 S |
|
H6_answer_pos:VERB |
0.637 |
0.129 |
8.72e-07 *** |
1.89 S |
|
H7_answer_log_probability |
0.0667 |
0.0148 |
6.75e-06 *** |
1.07 VS |
|
H8_answer_location |
-0.0103 |
0.00339 |
2.24e-03 ** |
0.990 VS |
|
H9_feedback:context |
0.268 |
0.0916 |
3.48e-03 ** |
1.31 VS |
|
H9_feedback:outcome |
0.163 |
0.0682 |
1.69e-02 * |
1.18 VS |
|
H10_reviewed |
-0.159 |
0.136 |
2.44e-01 |
-- |
|
Variable |
Estimate |
Std. Error |
p |
Odds Ratio |
|---|---|---|---|---|
|
H1_first_correct |
-1.22 |
0.0269 |
< 2e-16 *** |
0.294 M |
|
H2_cumulative_answered |
-0.00231 |
0.000358 |
1.24e-10 *** |
0.998 VS |
|
H3_spelling_suggestion |
-0.314 |
0.0661 |
2.02e-06 *** |
0.731 VS |
|
H4_sentence_textrank_rank |
1.19 |
0.0639 |
< 2e-16 *** |
3.28 M |
|
H5_answer_tf_idf_rank |
0.715 |
0.0564 |
< 2e-16 *** |
2.04 S |
|
H6_answer_pos:ADV |
1.13 |
0.0817 |
< 2e-16 *** |
3.09 M |
|
H6_answer_pos:NOUN |
0.209 |
0.0286 |
2.71e-13 *** |
1.23 VS |
|
H6_answer_pos:PROPN |
0.750 |
0.0609 |
< 2e-16 *** |
2.12 S |
|
H6_answer_pos:VERB |
0.812 |
0.0555 |
< 2e-16 *** |
2.25 S |
|
H7_answer_log_probability |
0.109 |
0.00673 |
< 2e-16 *** |
1.12 VS |
|
H8_answer_location |
-0.0142 |
0.00150 |
< 2e-16 *** |
0.986 VS |
|
H9_feedback:context |
0.185 |
0.0460 |
5.54e-05 *** |
1.20 VS |
|
H9_feedback:outcome |
0.273 |
0.0305 |
< 2e-16 *** |
1.31 VS |
|
H10_reviewed |
-0.0515 |
0.0594 |
3.86e-01 |
-- |
The results from the thumbs down models were highly consistent, with coefficient estimates having similar magnitudes and levels of statistical significance. The direction of the effect was the same for each explanatory variable in both models, and all were significant at p < .001 with the following exceptions: in the intercept per question model, H6_answer_pos:NOUN p < .05 (relative to H6_answer_pos:ADJ baseline), H8_answer_location p < .01, H9_feedback:context p < .01 and H9_feedback:outcome p < .05 (H9_feedback:common_answer baseline), and H10_reviewed was not significant in either model. This consistency indicates that while question-specific and student-specific sources of variance both contribute meaningfully to the outcome, neither dominates the results in a way that would significantly alter the study’s conclusions. The observed consistency provides strong indirect evidence that a full model with random intercepts for both questions and students would yield comparable results.
Determining which model—student intercepts or question intercepts—better fits the data is an important consideration. A common approach is to use a probabilistic metric that balances goodness-of-fit with model complexity. For explanatory models, the Bayesian Information Criterion (BIC) is frequently applied (Shmueli, 2010). BIC was substantially lower for the student intercepts model (101,572.9) than for the question intercepts model (123,342.0), indicating that the student intercepts model provides a better fit. The large difference in BIC suggests that student-level variance contributes more meaningfully to the observed relationships than question-level variance.
While all variables (except H10_reviewed) were significant, in large data sets statistical significance can be achieved even for trivial effects due to the sheer volume of observations. Therefore, examining effect sizes is crucial to determine the practical significance of the relationships. In Table 4a, the odds ratio for H4_sentence_textrank_rank (question sentence importance) is 2.34, meaning a question made from the least important sentence in a textbook chapter is estimated to be 2.34 times more likely to be given a thumbs down than one made from the most important sentence. This is considered a small (almost medium) effect size.
While nearly all variables are statistically significant, most effects are considered very small (six in the question intercept and seven in the student intercept model) or small (seven in the question intercept and three in the student intercept model). Three variables, H1_first_correct, H4_sentence_textrank_rank, and H6_answer_pos:ADV, had medium effect sizes in the student intercept model; all three were small in the question intercept model but near the small-medium boundary. While most of the explanatory variables are either categorical or defined on the interval [0, 1], three (for H2, H7, and H8) have odds ratios dependent on the variable’s units. For illustration, the odds ratio for H2_cumulative_answered is very close to 1 in both models (essentially no practical effect), but this is in units of per individual question answered. The impact for a more representative number of questions is more informative. After answering 100 questions (a small fraction of the questions generated for a typical textbook), the chance of a thumbs down is 1.8 times smaller (question intercept model). Likewise, over the approximate 10-unit range of log probabilities for H7 (measure of answer word rarity) in Figure 4, the odds ratio is a factor of 3 (student intercept model), considered a medium effect size.
|
Variable |
Estimate |
Std. Error |
p |
Odds Ratio |
|---|---|---|---|---|
|
H1_first_correct |
0.275 |
0.0187 |
< 2e-16 *** |
1.32 VS |
|
H2_cumulative_answered |
-0.000412 |
0.000152 |
.00682 ** |
1.00 VS |
|
H3_spelling_suggestion |
0.0473 |
0.0372 |
.203 |
-- |
|
H4_sentence_textrank_rank |
0.0439 |
0.110 |
.690 |
-- |
|
H5_answer_tf_idf_rank |
-0.137 |
0.112 |
.221 |
-- |
|
H6_answer_pos:ADV |
-0.230 |
0.232 |
.321 |
-- |
|
H6_answer_pos:NOUN |
-0.0213 |
0.0458 |
.642 |
-- |
|
H6_answer_pos:PROPN |
-0.152 |
0.102 |
.137 |
-- |
|
H6_answer_pos:VERB |
-0.159 |
0.118 |
.180 |
-- |
|
H7_answer_log_probability |
-0.0328 |
0.0100 |
.00108 ** |
0.968 VS |
|
H8_answer_location |
-0.00265 |
0.00239 |
.267 |
-- |
|
H9_feedback:context |
0.118 |
0.0704 |
.0951 |
-- |
|
H9_feedback:outcome |
0.0130 |
0.0520 |
.803 |
-- |
|
H10_reviewed |
-0.150 |
0.0955 |
.116 |
-- |
|
Variable |
Estimate |
Std. Error |
p |
Odds Ratio |
|---|---|---|---|---|
|
H1_first_correct |
0.350 |
0.0217 |
< 2e-16 *** |
1.42 VS |
|
H2_cumulative_answered |
-0.00170 |
0.000255 |
2.87e-11 *** |
0.998 VS |
|
H3_spelling_suggestion |
0.00781 |
0.0411 |
0.849 |
-- |
|
H4_sentence_textrank_rank |
0.178 |
0.0537 |
0.000943 *** |
1.19 VS |
|
H5_answer_tf_idf_rank |
-0.125 |
0.0548 |
0.0230 * |
0.883 VS |
|
H6_answer_pos:ADV |
-0.126 |
0.104 |
0.224 |
-- |
|
H6_answer_pos:NOUN |
-0.0295 |
0.0220 |
0.180 |
-- |
|
H6_answer_pos:PROPN |
-0.170 |
0.0518 |
0.00104 ** |
0.844 VS |
|
H6_answer_pos:VERB |
-0.171 |
0.0567 |
0.00250 ** |
0.842 VS |
|
H7_answer_log_probability |
-0.0289 |
0.00502 |
8.56e-09 *** |
0.972 VS |
|
H8_answer_location |
-0.00334 |
0.00116 |
0.00385 ** |
0.997 VS |
|
H9_feedback:context |
0.0316 |
0.0385 |
0.412 |
-- |
|
H9_feedback:outcome |
0.0413 |
0.0253 |
0.102 |
-- |
|
H10_reviewed |
-0.0573 |
0.0452 |
0.205 |
-- |
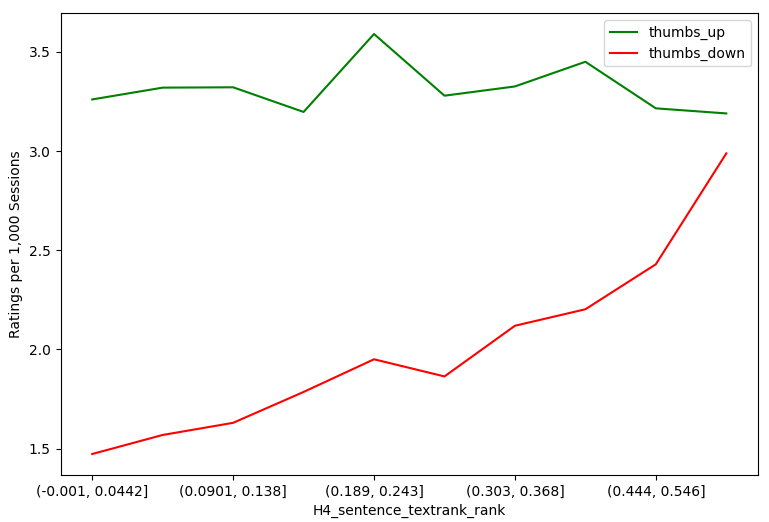
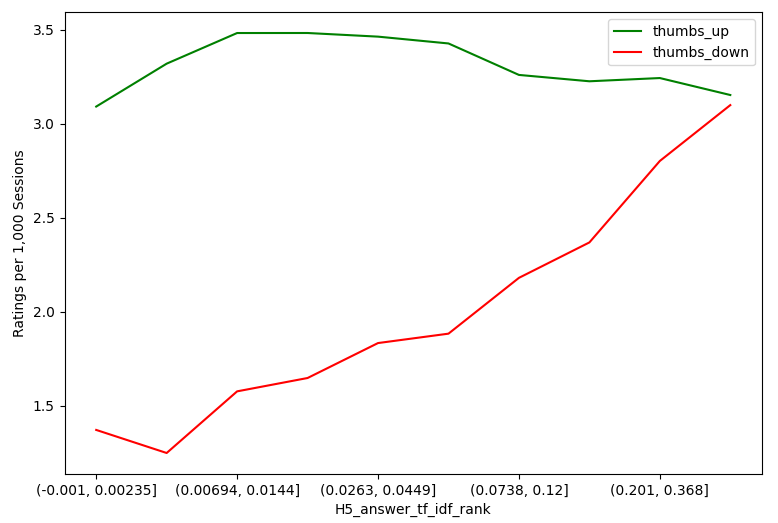
The two thumbs up models (in Tables 5a and 5b) show similar consistency with each other in terms of coefficient magnitude and direction, with the student intercepts model again exhibiting a substantially lower BIC score (139,631.8 vs. 210,658.0). However, they show qualitatively different results than the thumbs down models in terms of relating the explanatory variables to the outcome. Far fewer variables were statistically significant for thumbs up ratings (three in the question intercept and eight in the student intercept model), with all having very small effect sizes. The Figure 4 visualizations of rating results for individual quantitative variables make these differences particularly clear. For H2, cumulative questions answered, it is clearly seen that both thumbs up and thumbs down trend down in parallel the more questions students answer. H4 and H5 look very similar when mapped next to each other; for both the sentence importance and answer importance, thumbs up remain relatively unaffected while thumbs down increase as the importance level decreases. For H7, answer term log probability, we see that the more uncommon terms have more thumbs up than thumbs down, and the thumbs up decrease and thumbs down increase as the terms become more common. The H8 answer location graph shows an interesting trend that the thumbs up and down are opposite when the answer location is near the start of a sentence.
While the odds ratios quantify the practical impact of each variable, model selection techniques can be used to estimate their relative importance. BIC-based importance rankings provide a complementary perspective by assessing the overall contribution of each variable to model fit. Together, these metrics offer a fuller picture of the relationships between AG question features and student perceptions.
Variable importance was assessed using the initial step of a forward selection stepwise regression process, as follows: for each explanatory variable, a fixed effects model was fit including only that variable and an intercept, with its BIC value compared to that of an intercept-only model. Lower BIC scores are better, and in a forward selection process, the variable giving the greatest decrease in BIC would be selected for the model. Again, however, forward selection was not used to select the variables in the explanatory model; the technique is merely used here to obtain an estimated ranking of the variables by importance. The results are given in Table 6, with variables ordered by decrease in BIC relative to an intercept-only model.
|
Variable |
BIC |
|---|---|
|
intercept-only |
150,537.9 |
|
H1_first_correct |
-2,190.2 |
|
H2_cumulative_answered |
-1,187.6 |
|
H5_answer_tf_idf_rank |
-512.2 |
|
H4_sentence_textrank_rank |
-480.4 |
|
H9_feedback |
-414.8 |
|
H6_answer_pos |
-351.4 |
|
H3_spelling_suggestion |
-125.1 |
|
H7_answer_log_probability |
-100.1 |
|
H8_answer_location |
-75.0 |
|
H10_reviewed |
-20.6 |
Since few variables were statistically significant in the thumbs up models and all effects were very small, in contrast with the thumbs down models, a variable importance analysis was not performed for thumbs up.
Ratings by Subject
Another avenue of investigation is to determine if student ratings differ by textbook subject. The BISAC major subject heading classifications (Book Industry Study Group, 2022) are used for this subject-based analysis. It has been anecdotally observed that some textbooks seem to produce questions that students rate more favorably than others. These differences may stem from factors such as the clarity and specificity of the text, the author’s writing style, or the level of alignment between the text and the question-generation process. Could certain subjects receive different ratings from students? This BISAC subject was not included in the explanatory model, however, as a clear causal hypothesis about the relationship of subject to rating behavior was not evident, as would be required for the explanatory model.
There are 50 different BISAC subject values in the data set. As some textbooks in the data set did not have BISAC data listed, these were removed for the subject-based analysis. The data set was further reduced to subjects with at least 50 thumbs down, giving 17 subjects. The data set defined in this way contains 4,714,395 sessions, 90.4% of the original data set. The ratings per 1,000 sessions in this data set averaged 3.07 thumbs up and 2.03 thumbs down, similar to the entire data set. Table 7 shows the selected subjects, sessions, percentage of data set, books, and thumbs up and thumbs down ratings.
|
Subject |
% Data |
Sessions |
Textbooks |
Questions |
Students |
Thumbs Up |
Thumbs Down |
|---|---|---|---|---|---|---|---|
|
Medical |
15.9 |
826,582 |
1,193 |
131,904 |
81,993 |
3,475 |
1,556 |
|
Business & Economics |
15.2 |
794,750 |
1,449 |
130,246 |
70,747 |
2,358 |
1,616 |
|
Psychology |
13.8 |
717,593 |
698 |
87,001 |
49,774 |
2,046 |
1,688 |
|
Education |
10.0 |
519,659 |
1,036 |
80,466 |
44,838 |
1,411 |
1,041 |
|
Social Science |
9.2 |
479,094 |
1,051 |
90,403 |
45,336 |
1,323 |
953 |
|
Political Science |
5.2 |
272,626 |
458 |
39,771 |
20,318 |
562 |
390 |
|
Computers |
3.9 |
205,890 |
317 |
28,758 |
18,261 |
651 |
693 |
|
Science |
3.8 |
198,452 |
367 |
32,694 |
27,432 |
652 |
436 |
|
Language Arts & Disciplines |
3.8 |
195,598 |
310 |
22,489 |
14,103 |
364 |
287 |
|
Law |
2.4 |
123,476 |
414 |
33,076 |
12,058 |
333 |
254 |
|
Religion |
1.7 |
89,289 |
208 |
10,254 |
7,034 |
400 |
91 |
|
Health & Fitness |
1.6 |
82,544 |
116 |
12,611 |
6,790 |
216 |
137 |
|
Technology & Engineering |
1.3 |
67,081 |
229 |
15,724 |
8,274 |
254 |
162 |
|
Sports & Recreation |
1.0 |
53,583 |
72 |
5,503 |
4,338 |
174 |
96 |
|
History |
0.7 |
36,585 |
263 |
10,912 |
4,329 |
70 |
50 |
|
Family & Relationships |
0.7 |
34,194 |
40 |
2,999 |
2,552 |
77 |
70 |
|
Philosophy |
0.3 |
17,399 |
81 |
4,124 |
2,772 |
93 |
53 |
The data set including only the selected top subjects is still quite large, with over 4.7 million sessions. To better interpret this data set, we need to confirm that the results are not qualitatively different for this data set compared to the original. For thumbs down, a mixed effects model with random intercepts per question with the ten explanatory variables was qualitatively consistent with the model in Table 4, with all effect directions and significance levels unchanged and explanatory variable coefficients changing by less than 10%. For thumbs up, all effect directions and significance levels were the same except for H2_cumulative_answered and H3_spelling_suggestion, which gained a level in significance with coefficients 2-3 times larger relative to the model in Table 5.
For including subject in the model, Science was selected as the baseline level for the subject categorical variable because its thumbs up and thumbs down rates were closest to the global rates, and therefore any significant difference from Science is also a difference from the overall rates. Including subject in the models had little practical effect on the results for the original ten explanatory variables. All effect directions and significance levels were unchanged in both models with the exception that for thumbs up, H7_answer_log_probability was reduced by one significance level.
Even though a fair amount of variety is observed in ratings by subject before controlling for the explanatory variables (Figure 5), few subjects had statistically significant differences from the Science baseline when added to the model. The ordering of the 10 explanatory variables is the same as with the original data set. The results for significant subject levels are shown in Table 8. A feature importance analysis for thumbs down following the approach described earlier found that subject is 7th most important out of 11 variables. Subject is below answer POS (H6) and above spelling suggestion (H3) in importance.

Dashed lines indicate the overall mean thumbs up and thumbs down rates for comparison.
|
Subject |
Rating |
Estimate |
p |
|---|---|---|---|
|
Religion |
Thumbs down |
-0.645 |
.0414 * |
|
Language Arts & Disciplines |
Thumbs up |
-0.548 |
.00109 ** |
|
Medical |
Thumbs up |
0.259 |
.0204 * |
|
Political Science |
Thumbs up |
-0.362 |
.0159 * |
Discussion
The main question is which of the hypotheses in Table 1 are supported by the explanatory models created from the data. For each significant variable, the sign of the coefficient estimate, or relative magnitudes of the estimates for categorical variables with more than two levels, determine whether the corresponding hypothesis was supported. Both thumbs down models are consistent in this regard. Examples: H1_first_correct has a negative coefficient, meaning that a thumbs down is less likely when the student’s first attempt is correct, so H1 is supported. H6_answer_pos has the largest coefficients for the ADV and VERB levels, so ADV and VERB answer words are the most likely to receive thumbs down, so H6 is supported. Overall, H1-H8 are supported by the model. Given the explanatory modeling framework followed, this is evidence that the relationships in these hypotheses are causal (Shmueli, 2010).
H9 is only partially supported, because outcome feedback is statistically more likely to receive a thumbs down than common answer feedback, but not more likely than context feedback. This could be because even though context feedback has been shown to be more effective than outcome feedback, it also takes significantly longer to read (Van Campenhout et al., 2024b), which might reduce student satisfaction. Finally, H10, that manually reviewed questions will receive fewer thumbs down, was not supported because H10_reviewed was not statistically significant.
For thumbs up ratings, only three variables, H1_first_correct, H2_cumulative_answered, and H7_answer_log_probability were statistically significant in the question intercepts model. For all three, the direction of the effect was as predicted by the corresponding hypothesis, and thus hypotheses H1, H2, and H7 were supported. The other hypotheses were not supported for thumbs up because their corresponding variables were not significant. For the student intercepts model, these three variables and five additional variables were significant; however, when both models did not exhibit significance, we did not consider the corresponding hypotheses to be supported.
Another interesting overall finding is therefore that thumbs down ratings are more clearly related to the explanatory variables, and thus the hypotheses, than thumbs up ratings. This is useful for improving the AQG method to reduce the number of questions generated that are likely to receive thumbs down from students. This is particularly valuable because reducing thumbs down ratings is crucial for improving the overall student experience and satisfaction with the learning tool.
The lower BIC values for the student intercepts models relative to the question intercepts models highlight the importance of accounting for student-level variance in understanding ratings of AG questions. This underscores the significant role of individual differences in shaping student perceptions, aligning with educational psychology theories that emphasize the diversity of learning behaviors and experiences. While both student- and question-level factors influence ratings, the larger contribution of student-level variance suggests that efforts to improve AQG systems may also benefit from enhancing student engagement and tailoring experiences to individual needs. At the same time, the relatively smaller contribution of question-level variance suggests robustness of the AQG process in producing generally acceptable questions. The consistency of fixed-effect coefficients across both models further supports the robustness of the findings.
The variable importance assessment for the thumbs down model (Table 6) reveals that the two most important explanatory variables, H1_first_correct and H2_cumulative_answered, relate to aspects of student experience in addition to the characteristics of the question itself. Of the variables intrinsic to the AQG process, the three most important were H5_answer_tf_idf_rank (answer importance), H4_sentence_textrank_rank (sentence importance), and H9_feedback. Note in particular that these variables are important after controlling for the effects of the “experience-related” variables. It is qualitatively reasonable that the importance of the question’s answer and sentence should matter, as well as the type of feedback given upon an incorrect answer. The least important explanatory variable was H10_reviewed.
It is informative to look at some illustrative examples of questions that are more/less likely to receive thumbs down ratings. H6, the hypothesis that questions with verb and adverb answer words will receive more thumbs down, was supported. An example of a verb and an adverb question in the data set receiving multiple thumbs down are:
Verb answer word:
A program that calculates the distance between two cities might use the variable name “distance” to represent that value in memory.
Adverb answer word:
Rewarding rats for successfully navigating to the end of a maze provides researchers with an opportunity to objectively measure learning.
In these questions, the answer words “calculates” and “successfully” do not appear to convey significant useful information in the sentence, and several of the nouns or adjectives would appear to be a better answer choice.
The following are questions made from less important and more important sentences, which was confirmed to make a difference to thumbs down rating probability through H4:
Less important question sentence:
The fish flavor will get into the frying oil and affect the flavor of chicken, mozzarella sticks, vegetables, and French fries.
More important question sentence:
Experts have defined patient-centered interviewing as “following the patient's lead to understand their thoughts, ideas, concerns and requests, without adding additional information from the clinician’s perspective.”
To contrast the two, the less important sentence seems more like an example than a domain fact that needs to be learned, whereas the more important sentence gives a definition of what is likely a content key term.
The following two questions illustrate H7, that rarer answer words are less likely to receive thumbs down:
More common answer word:
Many health conditions increase the risk of mental disorders.
More rare answer word:
Intuitional Epistemology or Intuitionalism: Humans know by simply intuiting, or penetrating the depths of their inner sense of self and being able to discern what is true.
Here, the rarer answer word “epistemology” appears to be more subject domain-specific than the more common answer word “risk”, and thus may be perceived as more helpful.
In the analysis of ratings by textbook subject, it is surprising that despite having the highest thumbs down rate, Computers as a subject was only marginally significant at p = .0647. As seen in Figure 5, Computers was also the only subject with a higher thumbs down rate than thumbs up. As such, we felt this warranted investigation and so reviewed all 71 questions from the Computers subject with two or more thumbs down. Two categories of frequent issues were identified. The first factor contributing to the high thumbs down rate is questions made from example material. These example-based questions often do not correspond to facts or concepts that need to be learned. This is illustrated by the following questions (answer word underlined):
The values in the column labeled value4 go down by 1 every time, which means you need a multiplier of -1.
The sample program below puts constants to work.
The second case identified was questions where the answer term may lack sufficient domain specificity to be considered helpful, as noted in the results for H5. It is interesting to note that in some cases such questions might be improved by selecting a different answer word. The following questions are examples of this possibility:
In practice, the concepts of identity management and access control are interwoven and are difficult to separate.
If a relation containing data about patients has a value for weight that is missing for one of the patients, such an omission indicates a data completeness problem.
For example, it is conceivable that selecting “identity” as the answer in the first question and “completeness” in the second might increase their helpfulness perceived by students.
Future Research: Tuning the AQG System
Modeling ratings as a function of the question features had a practical goal of identifying features that may cause students to give more thumbs up or down—and as a result of this investigation, these findings could be used to make improvements to the automatic question generation system. Some of the examples already discussed make excellent examples; changing which parts of speech are selected for the answer term or the domain specificity of the answer term could reasonably impact ratings. While this is certainly an investigation for future research, it is also possible to estimate what impact tuning certain features could have by using the data and model herein.
Referring back to Table 3 and Figure 4, we can estimate improvement in thumbs down rate from the data set by using thresholds on the explanatory variables. Six of the ten variables are properties of the AQG process. Since the explanatory model has provided evidence that these variables have a causal relationship with thumbs down ratings, there is reason to expect that adjustments to the AQG process based on these variables could be used to improve (lower) the thumbs down rate.
Two of these six variables are categorical: answer POS and feedback type. Students do not like ADV and VERB answers as much (Table 3), and the common answer feedback type for incorrect answers results in a lower thumbs down rate than the other two feedback types. For these, the thumbs down rate could be improved simply by eliminating the answer POS and feedback types receiving higher thumbs down rates.
The other four explanatory variables are quantitative variables that could be viewed as tunable parameters in the AQG process. We can estimate the effect of setting thresholds for these variables. As a start, we look at setting a cutoff at the 80th percentile for each variable to see if this would be likely to make a meaningful improvement. If so, reducing the number of available questions by approximately 20% would not pose a problem in practice given that the CoachMe process generates more questions than needed, holding the excess in reserve as replacements for underperforming questions (Jerome et al., 2022).
What is most notable from Table 9 is that thumbs down is decreased without thumbs up changing very much. Yet we also notice that all four variables do not impact thumbs down rate the same. Sentence importance (H4) and answer importance (H5) have a larger thumbs down (-0.18 and -0.24 respectively) impact than answer log probability (H7) and answer location (H8) (-0.04 and -0.06 respectively). Therefore, we focus on estimating the decrease in the thumbs down rate by thresholding based on both H4 and H5. If both sentence importance (H4) and answer importance (H5) are thresholded, the amount of data is reduced by 34.7% (rather than 40% due to 5.3% of data in common for questions rejected by the thresholds), and the thumbs down rate would be reduced to approximately 1.62 per 1,000 sessions, with the improvement (-0.38) slightly less than the sum of reductions for the two variables due to the overlap.
The greatest advantage of explanatory modeling of the rating data—essentially student perception data—is the ability to act on the findings and engage in feedback loops to improve future question generation. In this investigation, we not only are able to identify explanatory variables that impact student ratings, but can estimate how much tuning certain variables could decrease thumbs down. Changing the AQG system, gathering new data, and comparing the results to this study would not only be interesting, but also the responsible course of action to improve the questions based on student feedback.
|
Variable |
Threshold |
Thumbs Down |
Δ Thumbs Down |
Thumbs Up |
Δ Thumbs Up |
|---|---|---|---|---|---|
|
H4_sentence_textrank_rank |
0.444 |
1.82 |
-0.18 |
3.34 |
0.03 |
|
H5_answer_tf_idf_rank |
0.201 |
1.76 |
-0.24 |
3.34 |
0.03 |
|
H7_answer_log_probability |
-10.9 |
1.96 |
-0.04 |
3.38 |
0.06 |
|
H8_answer_location |
3 |
1.94 |
-0.06 |
3.26 |
-0.05 |
Limitations
Some limitations of the present work should be noted. A modeling limitation is that random intercepts were not able to be included for questions and students simultaneously in the mixed effects models to account for repeated observations; only random intercepts for questions were able to be included. However, this was mitigated by the analysis described in the Methods section, and the consistency between models with only question or only student intercepts suggests the results would not be materially affected if both types of random effects could have been included.
Another potential limitation is that the majority of students in the data set self-selected to engage with the questions (a small percentage of the data is from courses where questions were assigned, changing engagement patterns (Van Campenhout et al., 2023b)). Within this largely voluntary population of students answering questions, all student ratings were also voluntary. An interesting future investigation would be to compare the results herein with a class of students who are asked to rate every question.
While the explanatory model identified several significant relationships between question features and student ratings, it is important to acknowledge that, as with any observational study, there may exist additional factors influencing student ratings that were not explicitly included, such as personal preferences or attitudes toward the subject matter. While this does not detract from the causal relationships identified in this study, it highlights the inherent complexity of interpreting student ratings and underscores the importance of future work to explore additional variables that could further refine the model.
Although the data set is extensive and includes a broad array of subjects, its generalizability to less common fields or specialized disciplines with fewer sessions might require further study.
Conclusion
This investigation provided valuable insights into the factors influencing student ratings of automatically generated questions, leveraging one of the largest known data sets of its kind. The novel data set included microlevel clickstream interactions gathered by an ereader platform, syntactic and semantic data derived from natural language processing, and student perception data gathered from thumbs up/down ratings—all used to learn more about the automatically generated questions provided as practice in online textbooks. Prior research on AG questions used similar microlevel data to analyze performance metrics, but the student rating data provided an interesting and new opportunity to learn about question features from a new source—the learners themselves. By applying an explanatory modeling framework, key relationships were identified between question features and student perceptions, providing actionable guidance for refining automatic question generation systems. These findings not only address gaps in the literature but also demonstrate the practical potential of large-scale educational data to inform system improvements.
Our analysis highlights the importance of considering both intrinsic question features, such as answer word importance and part of speech, and contextual factors, such as student engagement patterns, in shaping student perceptions. The results suggest that understanding and optimizing these factors can enhance student satisfaction, reduce the rate of negatively perceived questions, and ultimately improve the usability and acceptance of AQG systems in educational settings. Furthermore, the observed relationships between student-specific variance and ratings underscore the importance of individual differences in shaping perceptions, aligning with established theories in educational psychology.
This work makes several contributions to the field of educational data mining and automatic question generation. First, it complements prior research on AG questions by focusing on the causal relationships between question features and student perceptions. Second, the open-source release of the data set (VitalSource, 2024) enables the research community to validate and build upon this work. Finally, the study’s findings have practical implications for improving AG systems, such as integrating new features like chapter-level tf-idf to prioritize high-value answer terms.
Looking ahead, this research opens several pathways for future exploration. The integration of large language models alongside rule-based systems presents an exciting opportunity to further enhance AG question quality while maintaining factual accuracy. Additionally, incorporating adaptive features into AG systems, such as tailoring question generation to individual student profiles or subject-specific nuances, could further improve student engagement and satisfaction. Continued exploration of how AG questions impact learning outcomes, particularly in diverse and underrepresented educational contexts, will also be crucial.
By addressing both theoretical and practical aspects of automatic question generation, this study underscores the value of student-centered approaches in improving educational tools. These contributions are not only important for advancing AQG technology for education but also for enriching the educational experiences of students worldwide.
Acknowledgement
We are grateful to Michelle Clark for assistance in preparing this manuscript.
References
- Alshehri, Y. A. (2019). Applying explanatory analysis in education using different regression methods. In Proceedings of the 4th International Conference on Information and Education Innovations (ICIEI ‘19), 109-115. https://doi.org/10.1145/3345094.3345111
- Anderson, R. C. (2018). Role of the reader’s schema in comprehension, learning, and memory. In D. E. Alvermann, N. J. Unrau, M. Sailors, & R. B. Ruddell (Eds.), Theoretical models and processes of literacy (7th ed., pp. 136–145). Routledge. https://doi.org/10.4324/9781315110592
- Baker, R. S., & Inventado, P. S. (2016). Educational data mining and learning analytics. Emergence and Innovation. In Digital learning: Foundations and applications (pp. 1–15), George Veletsianos (Ed.). Athabasca University Press. https://doi.org/10.15215/aupress/9781771991490.01
- Bandura, A. (1977). Self-efficacy: Toward a unifying theory of behavioral change. Psychological Review, 84(2), 191–215.
- Black, P., & Wiliam, D. (2010). Inside the black box: Raising standards through classroom assessment. Phi Delta Kappan, 92(1), 81–90. https://doi.org/10.1177/003172171009200119
- Book Industry Study Group (2022). Complete BISAC subject headings list. https://www.bisg.org/complete-bisac-subject-headings-list
- Brooks, M. E., Kristensen, K., Benthem, K. J., Magnusson, A., Berg, C. W., Nielsen, A., Skaug, H. J., Maechler, M., & Bolker, B. M. (2017). glmmTMB balances speed and flexibility among packages for zero-inflated generalized linear mixed modeling. The R Journal, 9(2), 378–400. https://doi.org/10.32614/RJ-2017-066
- Cohen, J. (1988). Statistical power analysis for the behavioral sciences (2nd ed.). Routledge. https://doi.org/10.4324/9780203771587
- Das, B., Majumder, M., Phadikar, S., & Sekh, A. A. (2021). Automatic question generation and answer assessment: A survey. Research and Practice in Technology Enhanced Learning, 16, Article 5. https://doi.org/10.1186/s41039-021-00151-1
- Dittel, J. S., Clark, M. W., Van Campenhout, R., & Johnson, B. G. (2024). Exploring large language models for evaluating automatically generated questions. In Workshop on Automated Evaluation of Learning and Assessment Content at the 25th International Conference on Artificial Intelligence in Education (pp. 1–6). https://sites.google.com/view/eval-lac-2024/program
- Dunlosky, J., Rawson, K., Marsh, E., Nathan, M., & Willingham, D. (2013). Improving students’ learning with effective learning techniques: Promising directions from cognitive and educational psychology. Psychological Science in the Public Interest, 14(1), 4–58. https://doi.org/10.1177/1529100612453266
- Evert, S. (2009). Corpora and collocations. In A. Lüdeling & M. Kytö (Eds.), Corpus linguistics: An international handbook (Vol. 2, pp. 1212–1248). Mouton de Gruyter. https://doi.org/10.1515/9783110213881.2.1212
- Fellbaum, C. (2010). WordNet. In R. Poli, M. Healy, & A. Kameas (Eds.), Theory and applications of ontology: Computer applications (pp. 231–243). Springer Netherlands. https://doi.org/10.1007/978-90-481-8847-5
- Fischer, C., Pardos, Z. A., Baker, R. S., Williams, J. J., Smyth, P., Yu, R., Slater, S., Baker, R., & Warschauer, M. (2020). Mining big data in education: Affordances and challenges. Review of Research in Education, 44(1), 130–160. https://doi.org/10.3102/0091732X20903304
- Givón, T. (2001). Syntax: A functional-typological introduction (2nd ed.). John Benjamins.
- Goldstein, P. J., & Katz, R. N. (2005). Academic analytics: The uses of management information and technology in higher education. Educause. https://library.educause.edu/-/media/files/library/2005/12/ers0508w-pdf.pdf
- Gray, J. A., & DiLoreto, M. (2016). The effects of student engagement, student satisfaction, and perceived learning in online learning environments. International Journal of Educational Leadership Preparation, 11(1), 1–20. https://eric.ed.gov/?id=EJ1103654
- Honnibal, M., Montani, I., Van Landeghem, S., & Boyd, A. (2020). spaCy: Industrial-strength natural language processing in Python. https://doi.org/10.5281/zenodo.1212303
- Hubertz, M., & Van Campenhout, R. (2023). Leveraging learning by doing in online psychology courses: Replicating engagement and outcomes. In eLmL 2023: The Fifteenth International Conference on Mobile, Hybrid, and On-line Learning (pp. 46–49). https://www.thinkmind.org/index.php?view=article&articleid=elml_2023_2_60_50025
- Hunt, R. R., & Worthen, J. B. (Eds.). (2006). Distinctiveness and memory. Oxford University Press. https://doi.org/10.1093/acprof:oso/9780195169669.001.0001
- Jerome, B., Van Campenhout, R., Dittel, J. S., Benton, R., & Johnson, B. G. (2023). Iterative improvement of automatically generated practice with the Content Improvement Service. In R. Sottilare & J. Schwarz (Eds.), Lecture Notes in Computer Science: Vol. 14044. Adaptive Instructional Systems, HCII 2023. (pp. 312–324). Springer, Cham. https://doi.org/10.1007/978-3-031-34735-1_22
- Jerome, B., Van Campenhout, R., Dittel, J. S., Benton, R., Greenberg, S., & Johnson, B. G. (2022). The Content Improvement Service: An adaptive system for continuous improvement at scale. In Meiselwitz, et al., Lecture Notes in Computer Science: Vol 13517. Interaction in New Media, Learning and Games, HCII 2022 (pp. 286–296). Springer, Cham. https://doi.org/10.1007/978-3-031-22131-6_22
- Johnson, B. G., Dittel, J., & Van Campenhout, R. (2024). Investigating student ratings with features of automatically generated questions: A large-scale analysis using data from natural learning contexts. In Proceedings of the 17th International Conference on Educational Data Mining (pp. 194–202). https://doi.org/10.5281/zenodo.12729796
- Johnson, B. G., Dittel, J. S., Van Campenhout, R., & Jerome, B. (2022). Discrimination of automatically generated questions used as formative practice. In Proceedings of the Ninth ACM Conference on Learning@Scale, 325–329. https://doi.org/10.1145/3491140.3528323
- Koedinger, K., Kim, J., Jia, J., McLaughlin, E., & Bier, N. (2015). Learning is not a spectator sport: Doing is better than watching for learning from a MOOC. In Proceedings of the Second ACM Conference on Learning@Scale, 111–120. https://doi.org/10.1145/2724660.2724681
- Koedinger, K. R., McLaughlin, E. A., Jia, J. Z., & Bier, N. L. (2016). Is the doer effect a causal relationship? How can we tell and why it's important. In Proceedings of the Sixth International Conference on Learning Analytics & Knowledge, 388–397. http://dx.doi.org/10.1145/2883851.2883957
- Kurdi, G., Leo, J., Parsia, B., Sattler, U., & Al-Emari, S. (2020). A systematic review of automatic question generation for educational purposes. International Journal of Artificial Intelligence in Education, 30(1), 121–204. https://doi.org/10.1007/s40593-019-00186-y
- Liang, K.-Y., & Zeger, S. L. (1993). Regression analysis for correlated data. Annual Review of Public Health, 14(1), 43–68. https://doi.org/10.1146/annurev.pu.14.050193.000355
- McFarland, D. A., Khanna, S., Domingue, B. W., & Pardos, Z. A. (2021). Education data science: Past, present, future. AERA Open, 7(1), 1–12. https://doi.org/10.1177/23328584211052055
- Mihalcea, R., & Tarau, P. (2004). TextRank: Bringing order into text. In Proceedings of the 2004 Conference on Empirical Methods in Natural Language Processing, 404–411. https://aclanthology.org/W04-3252
- Mulla, N., & Gharpure, P. (2023). Automatic question generation: a review of methodologies, datasets, evaluation metrics, and applications. Progress in Artificial Intelligence, 12(1), 1–32. https://doi.org/10.1007/s13748-023-00295-9
- Nielsen, J. (1994). Usability engineering. Morgan Kaufmann. https://doi.org/10.1016/C2009-0-21512-1
- R Core Team (2021). R: A language and environment for statistical computing (Version 4.4.1) [Computer software]. R Foundation for Statistical Computing. https://www.R-project.org/
- Reardon, S. F., & Stuart, E. A. (2019). Education research in a new data environment: Special issue introduction. Journal of Research on Educational Effectiveness, 12(4), 567–569. https://doi.org/10.1080/19345747.2019.1685339
- Sainani, K. L. (2014). Explanatory versus predictive modeling. PM&R, 6(9), 841–844. https://doi.org/10.1016/j.pmrj.2014.08.941
- Shmueli, G. (2010). To explain or to predict? Statistical Science, 25(3), 289–310. https://doi.org/10.1214/10-STS330
- Shute, V. J. (2008). Focus on formative feedback. Review of Educational Research, 78(1), 153–189. https://doi.org/10.3102/0034654307313795
- Sweller, J. (1988). Cognitive load during problem solving: Effects on learning. Cognitive Science, 12(2), 257–285. https://doi.org/10.1016/0364-0213(88)90023-7
- Van Campenhout, R., Autry, K. S., Clark, M. W., Dittel, J. S., Jerome, B., & Johnson, B. G. (2025). Scaling the doer effect: A replication analysis using AI-generated questions [Manuscript submitted for publication].
- Van Campenhout, R., Brown, N., Jerome, B., Dittel, J. S., & Johnson, B. G. (2021a). Toward effective courseware at scale: Investigating automatically generated questions as formative practice. In L@S '21: Proceedings of the Eighth ACM Conference on Learning@Scale, 295–298. https://doi.org/10.1145/3430895.3460162
- Van Campenhout, R., Clark, M., Dittel, J. S., Brown, N., Benton, R., & Johnson, B. G. (2023a). Exploring student persistence with automatically generated practice using interaction patterns. In 2023 International Conference on Software, Telecommunications and Computer Networks (SoftCOM) (pp. 1–6). https://doi.org/10.23919/SoftCOM58365.2023.10271578
- Van Campenhout, R., Clark, M., Jerome, B., Dittel, J. S., & Johnson, B. G. (2023b). Advancing intelligent textbooks with automatically generated practice: A large-scale analysis of student data. In Proceedings of the 5th Workshop on Intelligent Textbooks, The 24th International Conference on Artificial Intelligence in Education (pp. 15–28). https://intextbooks.science.uu.nl/workshop2023/files/itb23_s1p2.pdf
- Van Campenhout, R., Clark, M., Johnson, B. G., Deininger, M., Harper, S., Odenweller, K., & Wilgenbusch, E. (2024a). Automatically generated practice in the classroom: Exploring performance and impact across courses. In Proceedings of the 32nd International Conference on Software, Telecommunications and Computer Networks (SoftCOM 2024), 1–6. https://doi.org/10.23919/SoftCOM62040.2024.10721828
- Van Campenhout, R., Dittel, J. S., Jerome, B., & Johnson, B. G. (2021b). Transforming textbooks into learning by doing environments: An evaluation of textbook-based automatic question generation. In Third Workshop on Intelligent Textbooks at the 22nd International Conference on Artificial Intelligence in Education CEUR Workshop Proceedings, 1–12. https://ceur-ws.org/Vol-2895/paper06.pdf
- Van Campenhout, R., Hubertz, M., & Johnson, B. G. (2022). Evaluating AI-generated questions: A mixed-methods analysis using question data and student perceptions. In M. M. Rodrigo, N. Matsuda, A. I. Cristea, & V. Dimitrova, V. (Eds.) Lecture Notes in Computer Science: Vol 13355. Artificial Intelligence in Education, AIED 2022 (pp. 344–353). Springer, Cham. https://doi.org/10.1007/978-3-031-11644-5_28
- Van Campenhout, R., Jerome, B., & Johnson, B. G. (2023a). Engaging in student-centered educational data science through learning engineering. In A. Peña-Ayala (Ed.), Educational data science: Essentials, approaches, and tendencies (pp. 1–40). Springer Singapore. https://doi.org/10.1007/978-981-99-0026-8_1
- Van Campenhout, R., Jerome, B., & Johnson, B. G. (2023b). The doer effect at scale: Investigating correlation and causation across seven courses. In Proceedings of LAK23: 13th International Learning Analytics and Knowledge Conference, 357–365. https://doi.org/10.1145/3576050.3576103
- Van Campenhout, R., Johnson, B. G., & Olsen, J. A. (2021). The doer effect: Replicating findings that doing causes learning. Presented at eLmL 2021: The Thirteenth International Conference on Mobile, Hybrid, and On-line Learning, 1–6. https://www.thinkmind.org/index.php?view=article&articleid=elml_2021_1_10_58001
- Van Campenhout, R., Johnson, B. G., & Olsen, J. A. (2022). The doer effect: Replication and comparison of correlational and causal analyses of learning. International Journal on Advances in Systems and Measurements, 15(1-2), 48-59. https://www.iariajournals.org/systems_and_measurements/sysmea_v15_n12_2022_paged.pdf
- Van Campenhout, R., Kimball, M., Clark, M., Dittel, J. S., Jerome, B., & Johnson, B. G. (2024b). An investigation of automatically generated feedback on student behavior and learning. In Proceedings of LAK24: 14th International Learning Analytics and Knowledge Conference, 850-856. https://doi.org/10.1145/3636555.3636901
- VitalSource. (2024). Supplemental Data Repository. https://github.com/vitalsource/data
- Zhang, R., Guo, J., Chen, L., Fan, Y., & Cheng, X. (2021). A review on question generation from natural language text. ACM Transactions on Information Systems, 40(1), Article 14, 1-43. https://doi.org/10.1145/3468889