Abstract
Transaction data documenting student course selection during academic planning pose novel opportunities for educational data mining to understand and predict student outcomes. These fine-grain data of student waitlist, add, and drop actions can explain the decision-making processes that lead to mismanaged course selection (e.g., dropping a course late with an institutional penalty). The present study investigates student late drops through the lens of late course enrollment. We document first-of-its-kind empirical differences in student academic planning behavior and their resulting workload. We then leverage records of consecutive student semesters to study the causality of the association between late course enrollment and late drops. Specifically, we apply cross-lagged panel models as a novel methodological lens on large-scale enrollment histories to test the specific directionality of the association over time. Results suggest that late course enrollment (17%) and late dropping (10%) are associated with a higher workload compared to students who do not enroll or drop late. This workload could not be explained by students being forced to take high-workload courses at the end of the academic planning period but rather by students’ own volition of taking more courses. Further, we find that students were more likely to drop courses with a high workload late, suggesting that students who drop late are unprepared for their workloads, especially if they enroll late and exhibit less regular course planning activity. Our results align with a causal hypothesis for the link between delayed enrollment and late course dropping, estimating the effect to be about 0.8 \(SDs\) of more course drops per \(SD\) of late course enrollment. This link is slightly stronger for students who enroll in courses with a higher course load and is stable across years of study. There was no reinforcement of late course dropping and delayed enrollment, bolstering support for a causal hypothesis. We discuss the implications of our findings for academic advising, including potential interventions targeting early planning and academic preparedness for course workload to mitigate over-enrollment related to preference uncertainty during delayed decision-making. All data analysis code used for this study is publicly available.1Keywords
1. Introduction
Educational data mining has taken increasing interest and has reported many successes in mining detailed enrollment records of students’ course selection in higher education (Jiang and Pardos, 2020, Fischer et al., 2020). Enrollment records can be defined as official records documenting students’ registration in courses or programs at an educational institution. These records can be used to study the prediction of course prerequisite courses of a given course (Jiang and Pardos, 2020), grade prediction (Jiang et al., 2019), next course prediction (Pardos et al., 2019), and the prediction of what sets of courses a student is likely to take in a future semester (Shao et al., 2021). However, course enrollment records only tell part of the story of undergraduate course selection activities: they represent what courses a student ends up with at the end of the semester rather than their process of adding, dropping, and waitlisting for courses. In contrast, detailed records of course transactions contain a history of these actions leading up to and occurring at the beginning of a semester, in addition to students’ final semester course sets. These records can reveal underlying processes. These processes trace the paths students traverse to arrive at their end-of-semester enrollments. Recent work in educational data mining has found that mining records of student course enrollment and drop decisions improves the semantic signal in enrollment data for prediction tasks, for example, inferring a course’s popularity and major diversity (Xu and Pardos, 2023).
With the emergence of this novel form of higher education data, past work has not yet empirically used transaction data to describe student academic planning for their semester. Academic planning refers to the process by which students organize and decide about their coursework and academic trajectory for a given period, such as a semester (Chaturapruek et al., 2018). It typically involves selecting courses, scheduling classes, balancing academic workloads, and aligning these choices with long-term goals such as fulfilling degree requirements, improving grades, or exploring interests. As US-American higher education grants students a relatively high degree of freedom in their course selection, students are expected to systematically add and drop courses to arrive at an optimal course set, with different students potentially following different strategies. Indeed, the phenomenon of students systematically enrolling in, waitlisting for, and dropping courses to retain their optimal set of courses during a semester, commonly known as course shopping, has received some attention in past research (Hagedorn et al., 2007). However, this work has used transcript data, which details different snapshots of student course baskets at different points of relevant planning periods (Hagedorn et al., 2007, Lenchner, 2017). Hence, to the best of our knowledge, the trajectory and trends in student add and drop activity throughout an academic planning period have not been empirically documented, which is a contribution of this research.
Unlike enrollment data of course selection outcomes, fine-grain timestamped records of student behavior allow for studying academic delay or the delayed completion of academic tasks such as course assignments (Hen and Goroshit, 2014). While past work has documented that academic delay can adversely affect student academic outcomes, for example, lower course achievement (You, 2015), academic delay has not been investigated through the lens of transaction data, which is another contribution of this work. More generally, a lack of research estimates the relationship between different features representing academic planning and student outcomes. For this study, one academic outcome of interest that can be purely derived from timestamped transaction data is late drops. Late drops are defined as students dropping out of an enrolled higher education course after an institutional deadline during which students are free to enroll and drop in eligible courses. Late course dropping is undesirable because it is costly for students and institutional resources.2 Among the top ten largest public universities in the United States in terms of the number of enrolled students, six out of ten require students to present documented proof of extenuating circumstances for late course drops (such as the death of a family member, call to military service, or illness of the student). Five out of these ten institutions denote such drops with markings on student transcripts. To date, past research in educational data mining has used enrollment records, such as course outcomes sequences, to understand late course drops (Salazar-Fernandez et al., 2021). However, these studies did not consider course transaction data of course add and drop processes, as featured in the present study.
In the context of transaction data, generating insight into when and how students mismanage their academic planning concerning an outcome of interest poses an opportunity for improving student outcomes. Using transaction data, Borchers et al. (2024) documented initial evidence for an association between delayed enrollment, regularity (i.e., even spacing) of academic planning behavior, workload, and late course drops. Specifically, students who dropped more courses late exhibited more delayed enrollment. Conversely, students who dropped fewer courses late also generally dropped courses earlier during the academic planning period and planned more regularly. These findings point to an association of delayed enrollment on academic planning, especially enrollment, and late drops as one form of academic achievement. However, these findings left open the question of whether delayed enrollment is more likely to cause late dropping or vice versa, which we seek to address in the current study by investigating the empirical support from observational data of different causal hypotheses. Another motivator for further extending the modeling of delayed enrollment stems from prior work in higher education whereby students have been observed to reinforce procrastination, one potential cause for delayed enrollment, through low-goal achievement (Wäschle et al., 2014). While the study by Wäschle et al. (2014) studied longitudinal trends in procrastination during an academic semester, an analogous “vicious cycle” of delayed enrollment may exist in student academic planning. Specifically, late course drops can be described as a form of low goal achievement, motivating the hypothesis that there would be a mutually amplifying link between delayed enrollment and late drops over time. The present research extends Borchers et al. (2024). In contrast to this work, we leverage large-scale enrollment data over consecutive student semesters to study the robustness and temporal sequence of the previously observed link between delayed enrollment and late drops. Specifically, we use cross-lagged panel models (Selig and Little, 2012, Mackinnon, 2012) to estimate whether late drops and delayed enrollment mutually reinforce over time. Alternatively, a link might only exist between delayed enrollment and same-semester late drops, not vice versa, supporting a causal hypothesis that delayed enrollment leads to subsequent late drops.
Finally, contextual factors underlying the effective course selection of a student might moderate the link between delayed enrollment and late course drops. First, past work motivates the hypothesis that surplus workload is associated with adverse academic outcomes (Smith, 2019) at least after personal resources to deal with high workloads are depleted (Huntington-Klein and Gill, 2021, Karimi-Haghighi et al., 2022). Therefore, a high workload, which increases with delayed enrollment (Borchers et al., 2024), could moderate the relationship between delayed enrollment and academic outcomes. One possible explanation for this moderation is that students who enroll relatively late may be compelled to register for more challenging courses with higher workloads. This hypothesis is informed by the findings of Borchers et al. (2024). If that theory is true, and high workload courses are especially adverse for students, then they might also late drop these courses more often. Further, if delayed enrollment leads to students being forced to take leftover, high-workload courses, that relationship could help explain why delayed enrollment makes late-dropping more likely. However, that relationship has not been investigated in prior work. Second, depending on a student’s nominal semester of enrollment (e.g., at the beginning or end of their program of study), delayed enrollment may also manifest different effects. For example, a student might satisfy, on average, more prerequisites during their earlier years of study or have fewer options for taking courses to graduate toward the end of their program. In those cases, it could be that student achievement in higher semesters of enrollment especially suffers from delayed enrollment, where few courses are left to take while specific courses are required to graduate. Therefore, as an additional potential moderator of the relationship between delayed enrollment and late dropping, delayed enrollment might have different implications depending on a student’s semester of enrollment. Therefore, we estimate the robustness of associations between delayed enrollment and late drops depending on the course workload a student enrolls in across different semesters of enrollment.
In summary, the present study addresses five research questions using fine-grained transaction data of student course add and drop records:
- RQ1: What do fine-grained course transactions (e.g., course shopping activities) look like in the lead-up to and at the beginning of a semester?
- RQ2: What is the relationship between academic planning inferred from transaction data (e.g., delayed enrollment and regularity of planning) and late course drops?
- RQ3: Are students who exhibit delayed enrollment more likely to late-add and late-drop courses with a relatively high workload?
- RQ4: Is there support for a causal hypothesis regarding the relationship between delayed enrollment and late course drops from observational data?
- RQ5: Is the relationship between delayed enrollment and late course drops moderated by the semester the student is in and their semester workload?
The present study makes the following contributions:
- First-of-its-kind empirical description of student academic planning through transaction data
- Empirical evaluation of delayed enrollment and regularity of planning inferred from transaction data on late drops
- Evidence that delayed enrollment (17%) and late-dropping (10%) are associated with higher semester workload out of students’ own volition rather than being forced to take on high-workload courses at the end of the academic planning period
- Evidence for students preferentially dropping courses with high workload
- Empirical support for the causal hypothesis that observed delayed enrollment leads to late drops, especially for high semester workloads
2. Background
Our investigation is inspired by prior research around the idea of course shopping in US-American higher education, where students strategically enroll, waitlist, and drop courses to optimize their schedule. We summarize recent research in educational data mining leveraging fine-grained transaction records and related institutional data to study phenomena germane to course shopping. We focus on the relationship between delayed enrollment and late course drops, the study of which could help improve student support and academic advising systems.
2.1. Course Shopping in US Higher Education
In US-American higher education, which grants students a relatively high degree of freedom in their course selection, the phenomenon of students systematically enrolling in, waitlisting for, and dropping courses to retain their optimal set of courses during a semester is commonly known as course shopping (Hagedorn et al., 2007). Course shopping gleaned from sequences of course enrollment and drops is likely to elevate insights into how students manage, and sometimes mismanage, their course load, eventually culminating in late course drops. Prior work identified that a substantial minority of students at one large community college engage in shopping, and that the specific type of shopping (e.g., substituting one course for another or retaining a large bulk of courses until late) is related to course completion rates and GPA (Hagedorn et al., 2007). Therefore, there is reason to assume that studying shopping can produce more insights into students’ academic outcomes. Further, recent evidence points to the idea that course shopping is increasingly common when students find the course catalog information insufficient for their academic planning (Scott and Savage, 2022). Therefore, studying student add and drop records could speak to suboptimal student course planning due to lacking information on a course until enrolling and taking the course.
However, to our knowledge, course shopping has not been studied through fine-grain transaction records as featured in this study. Instead, course shopping has previously been studied through the lens of transcript data (Hagedorn et al., 2007), questionnaires (Scott and Savage, 2022), and indicators from enrollment records such as late enrollment in courses (Lenchner, 2017). All studies only had access to smaller, selected samples of specific cohorts or majors, totaling less than 1,000 students. One exception is Lenchner (2017) with about \(3{,}000\) students across six years at a community college with part-time options. Another limitation of this past research on course shopping is that it categorizes students into coarse-grain shopping strategies without considering nuances and continuous differences in institutional academic planning trends that can be derived from finer-grain data, such as the transaction records studied here. For example, Hagedorn et al. (2007) derived different course shopping student profiles (e.g., substituting one course for another or retaining a large bulk of courses until late) and related these typologies to course completion rates and GPA. However, timestamped records of individual add and drop records allow for the engineering of more diverse features that characterize student course selection strategies. Therefore, there is an opportunity for a research contribution to describe course planning behavior through large-scale, fine-grained transaction data. To this end, the present study leverages data from over \(N=150{,}887\) student semesters at a large public university in the United States and with over 10 million fine-grain, timestamped records of student course transactions (e.g., waitlists, adds, drops).
2.2. Delay in the Completion of Academic Tasks and Academic Outcomes
The lens through which we operationalize course shopping behavior to explain late course drops is a behavioral delay in the completion of academic tasks observed from clickstream data, a topic of increasing interest to the educational data mining community and its adjacent disciplines (Sabnis et al., 2022, Baker et al., 2020). The educational data mining community has often framed such delays inferred from student-initiated log data records as procrastination (a student’s tendency to wait until late to complete tasks), for example, in understanding sociodemographic achievement gaps in course assignment completions (Sabnis et al., 2022). These lines of research draw such operational definitions of procrastination from earlier research proposing models of procrastination that are task and context-specific (Schouwenburg, 2004). These behavioral, task-specific measures of procrastination and self-regulation need to be interpreted with care given potential noise in the data, though they have shown utility in describing self-regulation and learning outcomes (Baker et al., 2020). Further, while past research provides evidence that students who take longer to enroll in courses or degree programs exhibit higher trait procrastination as assessed in surveys (De Paola and Scoppa, 2015, Reuben et al., 2015), the strengths of the associations reported in these studies do not satisfy common criteria for the psychometric validity of the measurement of traits. This is important because the field of personality psychology has moved away from a purely behavioral perspective on procrastination toward a trait definition of procrastination, meaning they relate to consistent individual differences over time and contexts (Steel, 2007), typically assessed through rigorously validated surveys (Kim and Seo, 2015). In recognizing consensus around procrastination as a trait, we do not call enrollment delay procrastination in the present study.
2.3. Higher Education Workload
Workload, as described in educational psychology, is a multi-dimensional construct that includes time load, mental effort, and psychological stress (Reid and Nygren, 1988). Time load refers to the number of hours spent engaging with course materials and completing assignments (Shedd, 2003), while mental effort encompasses the cognitive resources required to understand and process content (Paas et al., 2010). Psychological stress has been operationalized as excess workload in the workplace and measured via self-assessment (Ilies et al., 2010).
Despite the established multidimensionality of workload, higher education workload has long been measured through credit hours. This time-based system attempts to capture the effort students invest in their courses and is a legacy of the early 20th century and the elective system in the United States (Shedd, 2003). Recent studies have called into question the adequacy of credit hours as a proxy for course workload. For instance, Pardos et al. (2023) found that credit hours explained only 6% of the variance in student-reported workload, whereas features derived from learning management systems (LMS) captured 36%. This discrepancy underscores the need for more accurate workload analytics, such as course load analytics, referred to as CLA (Borchers and Pardos, 2023). CLA leverage LMS interactions, co-enrollment patterns, and course attributes to model the actual workload students experience, providing a more nuanced view and insights into student academic pathways, such as the comparatively high workload of students’ first semester (Borchers and Pardos, 2023).
Research on course recommendations and enrollment analytics has highlighted the potential for predictive models to guide students in selecting courses that align with their goals and capacities (Shao et al., 2021, Jiang et al., 2019). By offering insights into the real demands of courses, CLA could help capture mismatches between student expectations and the realities of academic workload. Such workload analytics could also help better understand student outcomes, as excessive workload in higher education has been linked to lower student well-being (Smith, 2019).
2.4. Late Course Dropping as Mismanagement
Investigating the delay in completing academic tasks through the lens of inferences from the novel, fine-grain data interests the educational data mining community as it could lead us to better student support. Specifically, studying the mechanism by which students end up with a suboptimal set of courses and subsequent adverse academic outcomes can guide intervention. Further, it can help understand why there is a robust link between academic task delay and academic outcomes established in prior research (Kim and Seo, 2015, Cormack et al., 2020). For example, it can reveal misalignments between students’ expectations and actual experiences of courses. Recent work showed that student course shopping can relate to insufficient information about a course (Scott and Savage, 2022). Therefore, a better understanding of late course dropping through data mining could inform student academic advising and course recommender systems, which is part of nascent research in the field (Shao et al., 2021, Jiang et al., 2019).
3. Methods
3.1. Study Context
The study sample includes institutional recordings of timestamped student course enrollments, waitlists, swaps, and drops (referred to as course transactions) between Fall 2016 and Spring 2022 at the University of California, Berkeley, a large public university in the United States. For this study, the data was provided in an anonymized format by an institutional data provider. Due to the data’s anonymized and privately held nature, an IRB approval was not necessary. All data storage and analysis were securely conducted on servers housed within the UC Berkeley data center, ensuring security and confidentiality throughout the research process.
UC Berkeley’s administrative structure includes subject areas as the most fine-grained academic unit. These areas are embedded in departments, followed by divisions and colleges. Further, UC Berkeley is a comprehensive public research university with various undergraduate, graduate, and professional programs across various disciplines. Its academic enterprise is organized into 15 schools and colleges, with 184 academic departments and programs. Presently, more than 1,500 faculty members and 45,000 students are affiliated with the university.3
3.2. Data Set
In our institutional data set of timestamped student course transactions, the unit of analysis or row represents students enrolling in or dropping classes, with a timestamp representing an updated enrollment status. A status token “E” means a student is directly enrolling in a class or enrolling from the waitlist, and the token “D” means a student is dropping a course.
| Variable | Quantity |
|---|---|
| Number of transactions | 11,136,719 |
| Number of transactions that affect student enrollment status | 10,495,919 (94.2%) |
| Number of transactions | |
| initiated by students | 9,457,735 (85.0%) |
| Number of transactions initiated by students that affect student enrollment status | 9,141,091 (82.1%) |
| Number of students | 150,887 |
| Number of unique semesters | |
| across students | 629,200 |
| Average number of add actions per student per semester | 4.62 |
| Average number of drop actions per student per semester | 3.58 |
| Average number of unique courses enrolled per student per semester | 3.44 |
We preprocess the transaction data to include only actions that affect enrollment status (drop, enroll) and actions that students initiate. Table 1 summarizes descriptive statistics on the transaction data.
3.3. Feature Engineering
3.3.1. Enrollment Periods and Late Drops
There are four main phases of enrollment at UC Berkeley: Phase 1, Phase 2, add-drop period, and late add-drop period. Undergraduates can only enroll in 13.5 units (about three classes) during Phase 1 and 17.5 units during Phase 2. They can add more units during the add-drop period. Phase 1 and Phase 2 happen near the end of the previous semester (with Phase 1 starting several weeks later for new students), while the add-drop period happens from a few days before instruction starts to about four weeks after the instruction begins. A late add-drop period occurs from week 4 to week 8. The late add-drop period is between the add-drop deadline and the late add-drop deadline. We refer to students dropping courses during that late add-drop period as “late droppers.” Further, we investigate student semester workload as the course load students retain after the add-drop deadline passes and take into the late add-drop period, not considering any course additions during the late add-drop period. The exact dates of these phases vary from Spring vs. Fall semesters (for instance, Phase 1 and Phase 2 are usually longer for fall semesters) and vary from semester to semester. We define late drops as any drop actions that occur during the late add-drop period, which usually involves a student fee.
3.3.2. Delay Index
Following common definitions based on the relative timing of student-initiated actions (Sabnis et al., 2022), we define a measure of delayed enrollment as enrolling or dropping relatively close to the add-drop deadline. Specifically, we calculate the relative time of the student’s action for each enrollment period (Phase 1 enrollment, Phase 2 enrollment, add-drop period, late add-drop period), normalizing it to a range of 0 to 1. \begin {equation} T_{\text {relative}} = \frac {T_{\text {action}} - T_{\text {start}}}{T_{\text {end}} - T_{\text {start}}} \end {equation} Then, we compute the median of the relative time of each student action type (enrollments, drops, and both actions polled). For our purposes, we define a high-enrollment delay student as a student who enrolls or drops later than the median time, representing groups of students with comparatively high and low levels of delayed enrollment. We define three types of delay: general, enroll, and drop. Students with high general delay have any enrollment action later than the median time. Analogously, high enroll-delay students enroll later than the median time, and high drop-delay students drop later than the median time. While our delay index is usually used as a continuous variable in our modeling, grouping students by median split is used for descriptive analyses, ensuring the maximization of group size balance.
3.3.3. Regularity Index
The regularity index represents the degree to which students exhibited regular course planning activity. The index is defined as the standard deviation (\(SD\)) of the difference in days (\(\Delta _i\)) between each enrollment action within an enrollment period. It is also divided by the total number of days of the enrollment period as normalization. \begin {equation} R_{idx} = \frac {SD(\Delta _2, \Delta _3, ..., \Delta _{n})}{N_{days}} \end {equation} where \begin {equation} \Delta _i = T_i - T_{i-1} \quad \text {for} \ i = 2, \ldots , n \end {equation} denotes the difference in days between the \(i\)-th and \((i-1)\)-th enrollment action, with \(n\) being the total number of actions; \(N_{days}\) is the total number of days in the enrollment period. The larger the regularity index, the more regularly the student enrolls/drops classes.
We calculate the regularity index separately for enroll (E), drop (D), and jointly for pooled actions, analogous to the delay index (see Section 3.3.2). Given that the regularity index is computed on the level of individual student semesters, the regularity index can not be computed for drops if students had dropped less than two courses before the add-drop deadline, which happened fairly often for drops (29.1% of student semesters) while omitting students for enrolls, as they showed no course planning activity in a given semester (10.0%). Still, student semester-level aggregation is required as our unit of analysis is late-dropped units in a given semester. Therefore, for regression modeling related to RQ2, we compute a control variable representing whether student semesters included less than two dropped courses before the add-drop deadline.
3.3.4. Course Workload Analytics
Course load analytics can represent a more accurate prediction of students’ workload experiences than credit hours alone by providing course-level estimates of time load, mental effort, and psychological stress based on learning management system and enrollment data (Pardos et al., 2023, Borchers and Pardos, 2023).
We generate course workload predictions on scales ranging from 1 to 5 for each course and semester via models trained and validated in prior work (Borchers and Pardos, 2023). The course workload predictions were generated by training machine learning models on survey-based ground-truth ratings of course load of students at UC Berkeley. These ratings were collected from students following the end of the Spring 2021 semester, who evaluated their courses in terms of time load, mental effort, and psychological stress, using a modified version of the Subjective Workload Assessment Technique (SWAT) (Reid and Nygren, 1988). Each workload dimension was rated on a five-point Likert scale, with data aggregated at the course level. To predict workload, the models used features derived from three data sources: (1) historical data from the Canvas Learning Management System (LMS), (2) student and course-level enrollment attributes, and (3) course2vec embeddings representing patterns of co-enrollment across courses (Pardos and Nam, 2020). The LMS data provided a range of interaction-based features, such as the number of assignments and forum activities. The enrollment data captured academic characteristics like credit hours and course GPA. The course2vec embeddings, analogous to word embeddings in natural language processing, helped encode the relationships between courses based on students’ co-enrollment histories. The models were trained using five-fold cross-validation, with a random search for hyperparameter tuning across multiple machine learning architectures, including linear regression, random forest, elastic net, and neural networks. Final predictions were generated by ensembling these models, as those achieved the highest predictive accuracy.
Following Borchers and Pardos (2023), we generate semester loads by computing sums of the predicted time load, mental effort, and psychological stress (Reid and Nygren, 1988). We do so based on all courses a student retained after the add-drop period. This semester workload represents the amount of course work students are completing while deciding to drop a course late. Based on the high intercorrelations of the three workload facets documented in Pardos et al. (2023), which can threaten the separability of parameters in regression modeling, we then averaged all three workload facets. Specifically, we first averaged the three facets of time load, mental effort, and psychological stress for each course, then summed up these averages for each student semester. This effectively produces a single workload measure for students per semester that is expected to represent workload more accurately than the total credit hour units of a student semester (Pardos et al., 2023).
3.4. Analysis Methods
3.4.1. Descriptive Distribution of Course Transactions
We generate two sets of calculations to explore the trend of adding and dropping throughout the semester for RQ1 (“What do fine-grained course transactions (e.g., course shopping activities) look like in the lead-up to and at the beginning of a semester?”). We first calculate the average number of courses students enroll, drop, waitlist, and swap for each day of the semester. Swaps are actions in which the student drops one class and enrolls in another class. We define day 0 as the day when Phase 1 begins and the last day (which varies by semester) as the late add-drop deadline. Then, to explore the effect of dropping and adding on student enrollment, we calculate the average student basket size for each day of the semester. Basket size is defined as the number of courses students are enrolled in at any given time. To calculate a student’s daily basket size, we keep a running tally of the number of classes students are enrolled in. We note each instance where a student enrolls in or drops a class daily and accumulate the changes for the day. Because students do not have add/drop activities every day of the semester, we then fill in the missing days by carrying over the previous days.
3.4.2. General Association between Academic Planning and Late Course Drops
To answer RQ2 (“What is the relationship between academic planning inferred from transaction data (e.g., delayed enrollment and regularity of planning) and late course drops?”), we fit generalized linear mixed models of the number of late-dropped units (see Section 3.3.1) for each student semester using a log-linear link suited for count data. Given that we have repeated measures on the student level across semesters, we use linear mixed models with a random intercept per student to adjust for their baseline frequency of dropping courses late. The model then estimates incidence rate ratios (\(IRRs\)) for each independent variable, representing the relative change in the incidence rate of late dropped course units associated with a one-unit increase in the corresponding predictor while holding other variables constant. For instance, if the \(IRR\) for the delay index is 1.5, it indicates that a one-unit increase in the delay index is linked to a 50% higher incidence rate of late dropped course units, assuming all other factors are held constant. In practical terms, this implies that higher levels of delay, as measured by the index, are associated with an increased likelihood of students late dropping course units. We fit three models, standardizing all independent variables to a mean of 0 and a standard deviation of 1 to ease the interpretation of a per-unit increase, effectively setting the unit to standard deviations, which separately test the effects of delay and activity regularity and whether each of them differs by enroll and drop actions, as described next.
Specifically, we compare four models through the Bayesian information criterion (\(BIC\)) described in Schwarz (1978) to investigate the effects of student enrollment delay and their regularity index on late course drops in a given semester. \(BIC\) is more suited for our model comparisons than the likelihood-ratio test would be, given our large sample size of \(629{,}200\) student semesters which would make the comparison very sensitive to significance while not adjusting for model complexity. These models feature up to five independent variables: enrollment delay, drop delay, enrollment regularity, drop regularity, and the control variables of having dropped more than one course.
The first model features a simple control variable indicating whether students dropped more than one course or not (see Section 3.3.3 for the rationale of this control variable) as shown in Equation 4. \begin {equation} \label {eq_control} \text {Y}_{ij} = \beta _0 + \beta _1 \text {Control}_{ij} + u_j \end {equation} where: \begin {align*} Y_{ij} & = \text {Number of dropped units for a given student semester} \\ \beta & = \text {Fixed intercept and independent variables} \\ u_j & = \text {Student intercept } j \\ \end {align*}
We then compare that baseline model to a model that additionally features each student semester’s delay and regularity index as the main effects (general activity model). For the general activity model, delay and regularity of activity are computed based on all enrollment actions; see Section 3.3.2 as shown in Equation 5 below. \begin {equation} \label {eq_general_procrastination_regularity} \text {Y}_{ij} = \beta _0 + \beta _1 \text {{Delay}}_{ij} + \beta _2 \text {Regularity}_{ij} + u_j \end {equation} Then, we sequentially replace the delay model with two main effects of enrollment and drop delay (dual delay model) and a model with two additional effects for regularity indices of enrollments and drops (dual delay and dual regularity model), as shown in Equations 6 and 7 below.
\begin {equation} \label {eq_dual_procrastination} \text {Y}_{ij} = \beta _0 + \beta _1 \text {EnrollDelay}_{ij} + \beta _2 \text {DropDelay}_{ij} + u_j \end {equation}
\begin {equation} \label {eq_dual_procrastination_regularity} \begin {aligned} \text {Y}_{ij} = \beta _0 + \beta _1 \text {EnrollDelay}_{ij} + \beta _2 \text {DropDelay}_{ij} \\ + \beta _3 \text {EnrollRegularity}_{ij} + \beta _4 \text {DropRegularity}_{ij} + u_j \end {aligned} \end {equation}
These model comparisons serve to inspect whether delay and regularity in activity (i) are related to late course drops and (ii) whether their effect depends on activity regarding enrollments and drops compared to general activity regarding both actions. In summary, the models include Model 1 (control variable), Model 2 (general delay index and regularity index), Model 3 (two separate delay indices for enroll and drop actions), and Model 4 (two separate regularity indices and two separate delay indices for enroll and drop actions), all inferring the number of late dropped units. All of these models were fitted to the data using standard, built-in generalized linear models function in R version 4.1.2 (R Core Team, 2024).
3.4.3. Comparative Analysis of Late-Dropped and Late-Added Courses
To answer RQ3 (“Are students who exhibit delayed enrollment more likely to late-add and late-drop courses with a relatively high workload?”), we first compute different descriptive statistics about the average number of courses and predicted workload semester units (CLA; Section 3.3.4). We do so for the end of the add-drop period and across students with high and low enrollment delay (median split) to compare the workloads taken into the late add-drop period. For students who dropped courses late, we further compare how much workload high-enrollment delay students retained after late-dropped courses. Finally, we contrast the average workload of each student-semester’s first and last added courses during the add-drop period between delay groups to inspect if high-enrollment delay students were left to take comparatively high-workload courses.
In addition, we aggregate the average predicted workload (see Section 3.3.4) of courses that
students who dropped late retained and dropped during the late add-drop period. We separately
average that load per enrollment delay group. We further conducted a two-factorial ANOVA
(with enrollment delay and late dropping groups as the independent variables) to test the
interaction between enrollment delay and course dropping (retained vs. late-dropped) with the
average course workload of courses students retained after the add-drop deadline as the
dependent variable as shown in Equation 8 below. The ANOVA model was fitted to the data
using the standard anova_lm() function from the statsmodels library in Python
version 3.10 (Seabold and Perktold, 2010). \begin {equation} \label {eq_anova_workload} \begin {split} \text {Workload}_{i} = \beta _0 + \beta _1 \text {EnrollDelay}_{ij} + \beta _2 \text {CourseDrop}_{i} \\ + \beta _3 (\text {EnrollDelay}_{i} \times \text {CourseDrop}_{i}) + u_j \end {split} \end {equation} We then repeat that procedure using the total
semester workload as the dependent variable instead of the average workload to disentangle
associations between the workload of individual courses and the sum-total workload with late
dropping.
To descriptively investigate whether students preferentially drop high-workload courses, we investigate whether students preferentially drop high-workload courses by computing each student-semester’s workload rank distribution. As workload predictions are distinct for each course and are a floating point number, no tie-breaking was required to induce such relative workload ranks in each student’s course set. We then separately aggregate the workload ranks of courses students late-dropped and retained (filtering student semesters with at least one late drop). We then plotted average ranks to understand student late drop decision-making better. We note that rankings were separately computed per number of enrolled courses for a fair comparison of rankings for semesters with low and high numbers of courses. We restricted the analysis to the most common total course enrollments in our sample: 4-7 courses, as we found patterns to be broadly consistent across semester course basket sizes.
3.4.4. Cross-Lagged Panel Models
Cross-lagged panel models are a popular method in the adjacent field of educational psychology leveraging longitudinal data of student behaviors and outcomes to study hypotheses related to causal links between study outcomes and traits or behaviors across time (Mackinnon, 2012). Cross-lagged panel models aim to test empirical support from observational data of alternative causal links between a student trait or behavior and outcomes by testing time-lagged relationships in both directions. Specifically, if an association in the model exists from \(a_1\) to \(b_1\) with \(a_1\) preceding \(b_1\), but not from \(b_1\) to \(a_2\) with \(b_1\) preceding \(a_2\) then there is support for a causal hypothesis between \(a\) and \(b\) based on observational data.
In educational data mining, causal inference methods for studying student outcomes and analyzing adaptive learning platforms receive increased attention, as evidenced by a workshop on causal inference at the EDM2024 conference (Botelho et al., 2024). Causal methods for longitudinal educational data, such as cross-lagged panel modeling, are especially suited for macro-level institutional data in higher education, spanning multiple semesters of student enrollment (Fischer et al., 2020). However, as featured in this study, they have not been used to study enrollment delay in relation to late drops. However, given that related models have been used to link procrastination to goal achievement in higher education (Wäschle et al., 2014), the method appears suited for applications in educational data mining of enrollment data. In our application of cross-lagged panel models, we focus on enrollment delay, which in prior work has shown positive associations with late dropping (Borchers et al., 2024).

Cross-lagged panel models in our study were specified as follows (see Figure 1 for a schematic overview). First, all predictor and outcome variables are centered around the group mean (i.e., student means as students are observed across multiple semesters), following standard recommendations (Bryk and Raudenbush, 1992), to describe within-student change. Second, the cross-lagged panel model adjusts for the course drop frequency or enrollment delay of the previous semester (i.e., autocorrelation) of a given student, which is represented in an autoregressive coefficient \(\beta \). Third, two separate crossover effects \(\lambda \) are fit to the data. Their relative effect size determines which variable is more likely to be the cause and which is the outcome. Hence, our method is adequate to test and compare different causal hypotheses but is not intended to establish causality like experiments and randomized controlled trials. In the case of the current study, these two crossover effects correspond to causal hypotheses of enrollment delay affecting subsequent late drops and late drops affecting subsequent enrollment delay. Fourth, covariances (\(Cov\)) between error terms and observed variables are modeled to account for shared variance that is not explained by the stability or cross-lagged effects. These covariances help control for time-specific influences and improve the robustness of parameter estimates for the cross-lagged and stability paths. Fifth, it is important to note that within-student variance in longitudinal trends can bias estimation in cross-lagged panel models (Hamaker et al., 2015), given that our present sample includes repeated observations per student (i.e., multiple semesters per student). Different extensions to partial out and estimate such within-student variations through individualized intercepts have been proposed (Mulder and Hamaker, 2021). In the present study, as we found random student intercepts to not be identifiable in our data, we defined students as a grouping variable during the model estimation process to adjust for potential correlations between observations from the same student and used robust standard error estimates to avoid biased \(p\)-values related to repeated observations of the same student. We also confirmed the robustness of our findings against fitting separate models using hierarchical mixed effects models inferring each outcome separately with a single stability and cross-lagged effect (similar to methods in Wäschle et al. 2014). Based on visual model inspection, no outliers or other violations of model assumptions were found.
To answer RQ4 (“Is there support for a causal hypothesis regarding the relationship between
delayed enrollment and late course drops from observational data?”), we compare and observe effect
sizes of the estimated \(\lambda \) parameters to study whether a causal or bidirectional link exists between
enrollment delay and late drops. To answer RQ5 (“Is the relationship between delayed enrollment and
late course drops moderated by the semester the student is in and their semester workload?”), we
compare the RQ4 model above to a model additionally featuring interactions between \(\lambda \) and semester
workload as well as \(\lambda \) and semester count. To compare whether these additional interactions improve
model fit, we compare \(BIC\) values of both models before interpreting the relevant interaction effects. All
cross-lagged panel models were estimated using structural equation models (SEM) that
were fitted using the lavaan package (Rosseel, 2012) in R version 4.1.2 (R Core Team,
2024).
4. Results
Before describing the main results, we report the correlation matrix for key student semester-level variables (Table 2). The matrix shows mostly weak relationships between variables, with the highest correlation observed between drop delay and enrollment delay (\(r\) = 0.52). Semester Workload exhibited weak negative correlations with enrollment delay (\(r\) = -0.07) and activity regularity (\(r\) = -0.09). Collinearity was checked using variance inflation factors (VIF), and all values were confirmed to be below 2, indicating no multicollinearity issues among the variables.
| 1 | 2 | 3 | 4 | 5 | |
| 1. Semester Workload | – | ||||
| 2. Enrollment Delay | -0.07 | – | |||
| 3. Late Dropped Units | -0.05 | 0.09 | – | ||
| 4. Drop Delay | -0.11 | 0.52 | 0.12 | – | |
| 5. Activity Regularity | -0.09 | -0.32 | -0.01 | 0.12 | – |
4.1. RQ1: Course Adding and Dropping Trends
Figure 2 illustrates the average weekly enrollment activities, including waitlisting, enrollment, dropping, and swapping courses across both spring and fall semesters. Fall semesters notably exhibit an extended Phase 1 compared to spring, with enrollment initially peaking at the phase’s start and sharply declining toward the end. A resurgence occurs at the beginning of Phase 2, followed by a gradual decrease through subsequent add-drop and late add-drop periods.
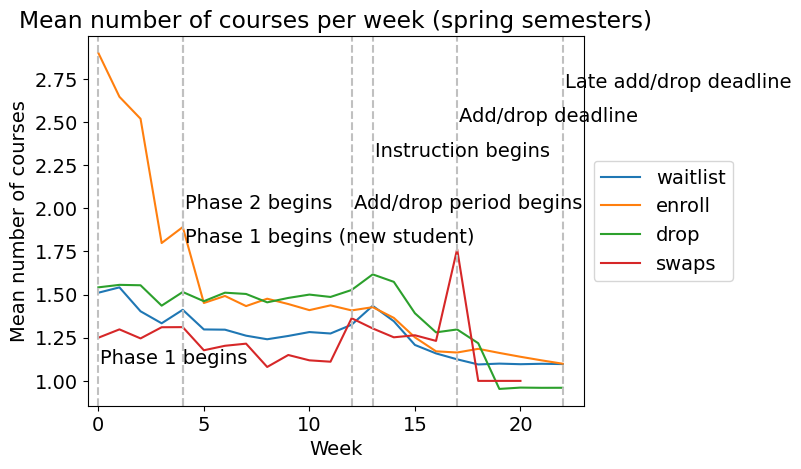
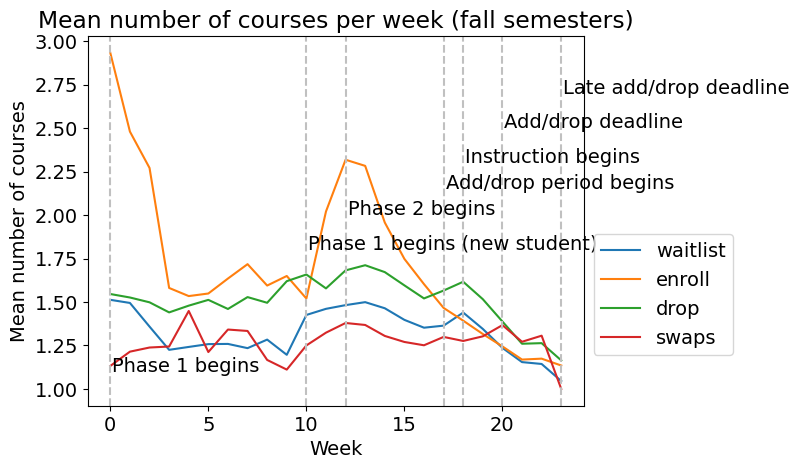
The spike in enrollment activity at the beginning of fall semesters is smaller than in spring semesters, likely due to a comparatively high influx of new undergraduates. This surge extends to waitlist, drop, and swap activities, peaking with the start of Phase 2. Conversely, spring semester drop activities maintain a steady low throughout Phases 1 and 2, rising sharply at the add-drop period’s onset and reaching their peak at the spring semester’s start of instruction. Drop activities consistently outnumber add activities from mid to late Phase 2 and throughout subsequent phases. Waitlists closely mirror drops, reaching their peak when instruction starts. Swaps remain low during initial phases but surge at the spring semester’s add/drop deadline. Across both semesters, enrollment activities respond to major enrollment events and deadlines, with similar patterns observed (however, activities peak at the start of Phase 2 because of new undergraduates joining in the fall). Notably, the most significant fluctuations occur during Phase 1, characterized by a sharp drop in add activities followed by a gradual increase. Furthermore, approximately 52.4% of spring semester add-drop activities occur during Phase 1, covering roughly the first 25% (first 5 weeks) of enrollment phases, while in fall, this proportion is 40.0%, spanning the initial 50% (first 10 weeks). We note that these patterns related to enrollment phases were generally consistent across students of different years of enrollment (years one through four) based on visual inspection of plots not included in this manuscript.
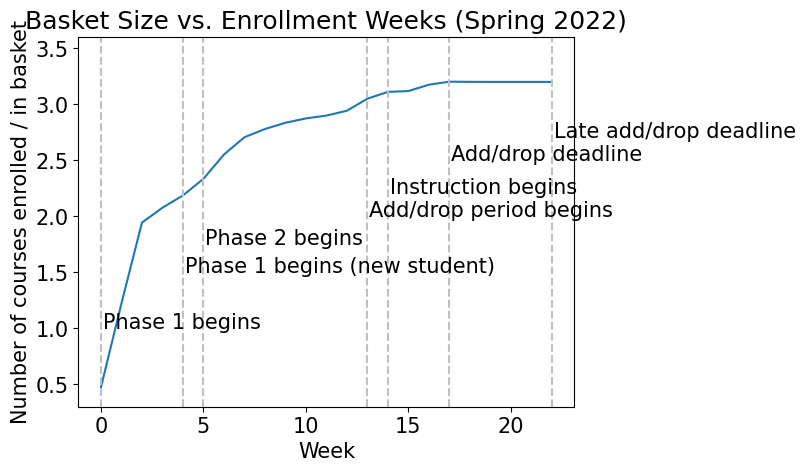
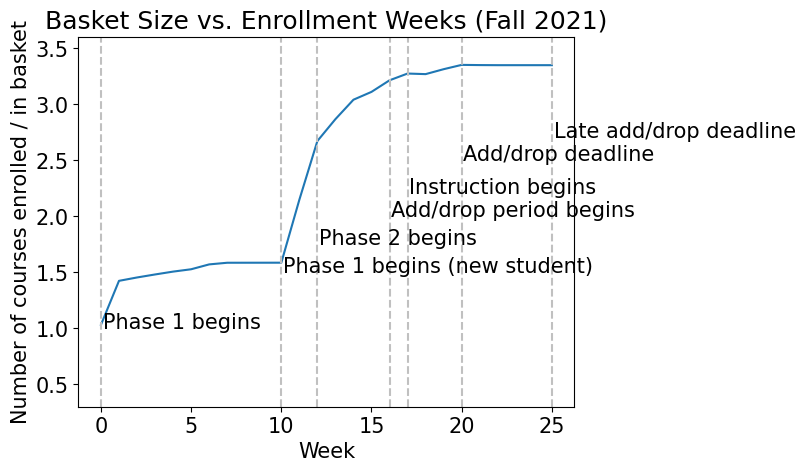
We also explore how student basket size changes throughout the semester, week by week. Analyzing the time series (Figure 3), which illustrates the average changes in student basket size, we observe fluctuations coinciding with major enrollment deadlines. At the outset of Phase 1, basket sizes surge rapidly for continuing students and spike further as Phase 1 commences for new undergraduates. This surge gradually tapers until the onset of Phase 2, where basket sizes experience a steady increase, punctuated by a minor spike when instruction starts. Subsequently, basket sizes stabilize during the add-drop period. A comparison between spring and fall semesters reveals a prolonged plateau during Phase 1 for fall semesters due to the extended duration of their Phase 1 period. Additionally, a more substantial spike in basket size occurs when new undergraduate students enroll during fall semesters. Comparing the two plots, despite drop activities surpassing add activities at mid-to-late Phase 2, we observe no substantial decreases in average basket size throughout the entire enrollment period. However, this intersection may be reflected by the varying rates of change in basket size: a larger increase at the start of Phase 2 and a smaller one at the midpoint. Overall, the absence of a decrease in basket size suggests that the rise in dropping actions does not sufficiently counterbalance the decline in enrollment actions, resulting in a net decrease in average basket size.
4.2. RQ2: Relationship Between Delay and Late Dropping
RQ2 relates to the relationship between delay and late course dropping. A model that distinguishes between activity types (enrollments vs. drops) in terms of delay but does not distinguish between activity types in terms of activity regularity described the data best. Specifically, the dual delay model had the lowest \(BIC\) (\(2{,}763{,}638\)) followed by the general activity model (\(BIC = 2{,}771{,}557\)), the baseline (\(BIC = 2{,}935{,}188\)), and the dual regularity model (\(BIC = 3{,}587{,}051\)). We refer to Section 3.4.2 for model references. The modeling results of the chosen dual delay model are summarized in Table 3.
| Variable | \(IRR\) | \(CI_{95\%}\) | \(p\) |
|---|---|---|---|
| Intercept | 9.47 | 9.46 – 9.48 | \(<.001\) |
| Dropped More than 1 Course | 0.55 | 0.55 – 0.55 | \(<.001\) |
| Enrolled Later | 1.06 | 1.06 – 1.06 | \(<.001\) |
| Dropped Later | 0.93 | 0.93 – 0.93 | \(<.001\) |
| Higher Regularity in Activity | 0.79 | 0.79 – 0.79 | \(<.001\) |
As shown in Table 3, the coefficients derived from the selected model offer insights into the determinants of late dropped units. Notably, the variable “Dropped More than 1 Course” exhibits a coefficient of 0.55, indicating a 45% reduction in the expected incidence rate of late dropped units for students who dropped at least two courses during the add-drop period. Conversely, “Enrolled Later” yields a coefficient of 1.06, signifying a 6% increase in the expected incidence rate for each unit increase in the predictor. “Dropped Later” and “Higher Regularity in Activity” contribute coefficients of 0.93 and 0.79, respectively, suggesting a 7% decrease and a 21% decrease in the expected incidence rate per \(SD\) increase in their respective predictors.
4.3. RQ3: Workload of Late-Added and Late-Dropped Courses
RQ3 relates to whether students exhibiting delay in academic planning are more likely to late-add and late-drop courses with a relatively high workload. A potential mechanism of the link between delay in academic planning and late drops is that the courses students end up enrolling in are suboptimal (e.g., due to a higher workload students are less prepared for) or because students with higher semesters of enrollment have specific enrollment goals (such as satisfying remaining requirements) but have fewer options to achieve those goals. In other words, enrollment delay may go hand in hand with needing to select from a suboptimal (leftover) and high-workload course set. To shed light on this issue, we investigate what types of courses students are more likely to add and drop late.
High-enrollment delay students and late droppers enrolled in more courses and higher semester loads. Descriptively, students who exhibited high degrees of enrollment delay not only enrolled in more courses but also took on a higher predicted semester load at the end of the add-drop deadline (\(M = 10.23\) courses and \(M = 27.17\) \(CLA\) for low-enrollment-delay students compared to \(M = 11.96\) courses and \(M = 31.79\) \(CLA\) for high-enrollment-delay students). This corresponded to 16.9% more courses and 17.0% more predicted workload per average semester. Similarly, late-droppers enrolled in more courses and took on a higher predicted semester load (\(M = 10.92\) courses and \(M = 29.00\) \(CLA\) for non-late-dropper students compared to \(M = 11.96\) courses and \(M = 31.82\) \(CLA\) for late-dropper students). This corresponded to 9.6% more courses and 9.7% more predicted semester workload per average semester. For high-enrollment delay students who late-dropped, these numbers were even higher: 26.5% more courses and 26.7% more predicted semester workload.
High-enrollment delay students retained a higher course workload after late drops. This pattern was also evident in the course workload high-enrollment delay students retained after they late-dropped. Specifically, high-enrollment delay students retained a higher course load and predicted semester workload even after dropping courses (\(M = 10.23\) courses and \(M = 25.25\) \(CLA\) for low-enrollment-delay students compared to \(M = 11.96\) courses and \(M = 28.57\) \(CLA\) for high-enrollment-delay students). This represents a 13.1% increase in predicted \(CLA\) and a 16.9% increase in the number of courses retained.
High-enrollment delay students were not left to choose high workload courses at the end of the add-drop deadline. Examining the average \(CLA\) of the first and last courses added by high-enrollment delay students, there was no evidence that high-enrollment delay students were left to take higher workload courses at the end of the academic planning period. On average, both low- and high-enrollment delay students’ last added course featured typical \(CLA\) (\(M = 2.68\)), which is about average on the 5-point scale. This was also the case for the first course added (\(M = 2.71\) \(CLA\) and \(M = 2.70\) \(CLA\) for low- and high-enrollment-delay students, respectively).
Students generally late-dropped courses with higher workloads. In line with Figure 4, students who dropped courses late dropped courses with a higher predicted load than those courses that were retained. Averages and effect sizes ranged from \(M = 2.71\) compared to \(M = 2.67\), \(d = 0.17\) for low-enrollment delay students to \(M = 2.72\) compared to \(M = 2.68\), \(d = 0.18\) for high-enrollment delay students. Based on an ANOVA, there was no interaction effect between course type (late dropped vs. retained) and enrollment delay group (\(F(1) = 0.05, p = .306)\). Rather, both groups generally late-dropped comparatively high workload courses (\(F(1) = 52.44, p < .001)\). Another main effect indicated that high-enrollment delay students generally enrolled in higher workload courses (\(F(1) = 10.26, p = .001)\).
High-enrollment delay students dropped a smaller workload ratio than other late-dropping students. Looking at the total workload sum across the same groups of students painted more nuances (Figure 4). Low-enrollment delay students who late dropped retained an average of \(M = 8.17\) \(CLA\) and dropped an average of \(M = 2.90\) \(CLA\) (26.2%). In contrast, high-enrollment delay students who late dropped retained an average of \(M = 13.89\) \(CLA\) and dropped an average of \(M = 3.56\) \(CLA\) (20.4%). This means that enrollment high-enrollment delay students who late dropped enrolled in more work and retained more workload even after late dropping. This interaction was significant (\(F(1) = 6018.01, p<.001\)) as well as the corresponding main effects of enrollment delay (\(F(1) = 9568.80, p<.001\)) and late dropping (\(F(1) = 80100.25, p<.001\)).


The pattern that students with high levels of enrollment delay enrolled in and retained more workload is also evident in Figure 5. Specifically, students with low enrollment delay were overrepresented in student semesters with more than two late course drops (Figure 5, left). Conversely, high-enrollment delay students held on to more courses and were overrepresented in the student semesters that retained more than four courses (Figure 5, right).

Students preferentially late-dropped their second-highest workload course. The finding that students preferentially dropped courses with high workload is also evident in Figure 6, where high workload courses tended to be late-dropped more frequently than random dropping would predict. Based on Figure 6, two additional observations can be made. First, students most commonly dropped the second highest workload course. Second, low-enrollment delay students more commonly late dropped courses with below-average workloads in their course set than their high-enrollment delay peers. These patterns were broadly consistent across the total number of enrolled courses, with Figure 6 visualizing each of the most common number of courses in an undergraduate student semester: 4, 5, 6, and 7 courses.

4.4. RQ4: Causal Hypotheses Regarding the Relationship Between Delayed Enrollment and Late Drops
RQ4 focuses on the empirical support from observational data for different causal hypotheses related to the relationship between enrollment delay and late course drops. A cross-lagged panel model was estimated to describe associations between enrollment delay and late drops as well as late drops and enrollment delay, respectively (Table 4).
| Regression Paths | Estimate | SE | z | p |
|---|---|---|---|---|
| Enrollment Delay
| ||||
| Drops \(\rightarrow \) Enrollment Delay | 0.004 | 0.00 | 8.42 | <.001 |
| Enrollment Delay \(\rightarrow \) Enrollment Delay | -0.25 | 0.00 | -107.61 | <.001 |
| Drops
| ||||
| Enrollment Delay \(\rightarrow \) Drops | 0.84 | 0.06 | 13.09 | <.001 |
| Drops \(\rightarrow \) Drops | -0.31 | 0.01 | -45.37 | <.001 |
The cross-lagged effect of enrollment delay on subsequent late drops was substantial at \(\lambda \) = 0.84. This association indicates that students were estimated to drop 0.84 \(SDs\) of credit units more if their enrollment delay was 1 \(SD\) larger than their average semester. It is worth noting that late drops were negatively autocorrelated as adjusted for by the cross-lagged panel model, \(\beta \) = -0.31. In contrast, there was a negligible cross-lagged effect of late drops on subsequent enrollment delay (\(\lambda \) = 0.004). Similar to late dropping, enrollment delay was also negatively autocorrelated (\(\beta \) = -0.25).
4.5. RQ5: Moderation of the Link between Enrollment Delay and Late Drops Across Semester of Enrollment and Effective Workload
RQ5 asks about potential semester workload and semester count interactions with the relationship between enrollment delay and late enrollment. Given that the estimated cross-lagged panel model provided no evidence for an association between late dropping and next-semester enrollment delay, we only report results for interactions between (1) enrollment delay and semester load and (2) enrollment delay and semester count, each on late drops. Fitting a model featuring interaction between a student’s semester workload and semester count in interaction with the effect of enrollment delay described the data better than a cross-lagged panel model without such terms (\(BIC\) = 666\(,\)902.8 compared to \(BIC\) = 666\(,\)948.4).
For the interaction model, enrollment delay continued to show a positive association with subsequent late-dropped units across student semesters and workload packages, with a substantial effect size of \(\beta = 0.82\), \(SE = 0.08\), \(z = 10.27\), \(p < .001\). This main effect was qualified by a significant positive interaction of workload (\(\beta = 0.04\), \(SE = 0.01\), \(z = 6.14\), \(p < .001\)), indicating that students with higher semester workloads late-dropped even more units when they delayed enrollment. However, given the comparatively small effect size of this interaction relative to the main effect of enrollment delay, there is overall evidence of a robust association between enrollment delay and late drops across students and their semester workload packages. The interaction between semester of enrollment and the effect of delayed enrollment on late drops was not statistically significant (\(\beta = 0.02\), \(SE = 0.02\), \(z = 1.42\), \(p = .156\)). As before, late drops were negatively autocorrelated (\(\beta = -0.31\), \(SE = 0.01\), \(z = -45.41\), \(p < .001\)), and so was enrollment delay (\(\beta = -0.25\), \(SE = 0.002\), \(z = -107.62\), \(p < .001\)).
5. Discussion
The present study has investigated how detailed transaction data of student course adds, drops, waitlists, and swaps can reveal patterns in how students plan for their academic semester and elevated insights into how these patterns relate to late drops, an undesirable outcome of student course planning. A central goal of this study was to investigate the relationship between enrollment delay on course enrollment (i.e., enrolling in courses late during the academic planning period) and late course dropping propensity. Course shopping and delaying enrollment are well-known concepts in higher education research but have not been studied through detailed transaction records.
5.1. General Insights into Academic Planning Behavior
RQ1 asked about the distribution of course transactions during the academic planning period. We contribute a novel, fine-grain documentation of student course add and drop behavior related to institutional deadlines. Nearly half (46.1%) of add and drop activities occur during Phase 1 during the spring semester, spanning approximately the first quarter to half of the enrollment period. A similar pattern was observed for the fall semester, with the first 50% (10 weeks) of enrollment phases covering 40% of activity. During this phase, significant fluctuations in course add activities were observed, stabilizing in later phases. Unlike course add activities, which peak at Phase 1’s onset, drop and waitlist activities peak at instruction commencement, while swap activities peak at the add/drop deadline. Notably, patterns in basket size changes emerge between spring and fall semesters, reflecting responses to varying enrollment events and add/drop activity changes. Our findings could be generalizable to other US universities: although the exact deadlines and timeframes may differ from institution to institution, eight out of the ten largest US public universities enforce similar enrollment phases as observed at UC Berkeley, such as add-drop period, late add period, or enrollment period based on priority groups. These observed patterns can guide institutions in allocating academic advising resources, potentially enhancing nascent course recommendation systems (Jiang et al., 2019). Moreover, they prompt exploration into the types of courses students enroll in early versus late and their subsequent behaviors. Understanding the course attributes linked to these enrollment patterns—such as popularity, prerequisite satisfaction, and course-level GPA—can provide valuable insights for academic advising and student success initiatives.
5.2. Regular Planning as a Dropout Intervention Strategy
Distilling features from transactions to describe general relationships between academic planning and late dropping (RQ2), we found enrollment delay and irregular academic planning associated with late course dropping. Further, dropping courses before the add-drop period was associated with less late dropping. Why was early dropping positively associated with a lack of late dropping? It might prevent students from overloading on too many courses before the add-drop deadline, after which they must drop a course late, which aligns with a theoretical model of limited workload coping resources argued for in prior work (Huntington-Klein and Gill, 2021, Karimi-Haghighi et al., 2022). A potential mechanism for students sticking to courses despite an excessive workload is loss aversion, where dropping a course and losing the opportunity to take it weighs more heavily than enrolling in a course, making students inclined to over-enroll (Gal and Rucker, 2018). This hypothesis could be further studied in future work by measuring student-level loss aversion through questionnaires (Li et al., 2021). Alternatively, it could be the case that students drop courses earlier if they have a better sense of what courses are manageable or not for them (e.g., by planning more thoroughly for their semester). Indeed, we found that students who regularly plan to add and drop courses dropped fewer courses late. This aligns with past work that has found related findings where the sequentiality and regularity of student campus behaviors were associated with academic performance (Wang et al., 2020). Regularity in behavior could be explained by an underlying trait of conscientiousness, which prior work has associated with a moderator of individuals’ ability to follow through with plans and intentions, for example, preparing for the semester early (Lippke et al., 2018).
How can students who over-enroll and do not regularly plan be supported? A fruitful avenue for future work is to devise academic planning interventions that support students in planning their semester earlier on and more regularly. Such interventions could mitigate some of the adverse outcomes of delaying academic tasks in higher education, for example, lower self-efficacy (Wäschle et al., 2014) and lower academic performance measured in GPA (Kim and Seo, 2015). Course recommender systems that run on enrollment data might support students in devising academic plans more regularly and early while monitoring for course load expressed in analytics (Jiang et al., 2019, Borchers and Pardos, 2023). Finally, if the loss aversion hypothesis is true, interventions exist to frame decision-making more around longer-term horizons (e.g., reminding a student that a short-term course drop can be coped with in future semesters). These interventions could mitigate loss aversion based on experimental evidence from economics (Fellner and Sutter, 2009).
5.3. Enrollment Delay, Late Drops Were Associated with High Workload
RQ3 related to whether students were likelier to late-add and late-drop high-workload courses. Our findings indicate that high-enrollment delay students do late-drop higher workload courses and take on higher semester workloads. However, they also do not indicate that their enrollment delay forces them to take on higher workload courses, as their late-adds were close to equal to other students’ late-adds in terms of workload. This means students exhibiting delayed enrollment take on more workload by choice: their delay in academic planning activities does not require them to take on high workload, leftover courses. However, it is not inconceivable that the courses that these students need to take are suboptimal in other ways. For example, it could be that these courses are less clear about their course requirements, and students have a hard time envisioning the workload these courses entail (Scully and Kerr, 2014), which aligns with past research on course shopping (Scott and Savage, 2022). Based on this theory, students who delay their enrollment are unaware of the workload they signed up for, as predicted workload often misaligns with institutional credit hours (Pardos et al., 2023). However, contrary to that interpretation, the number of courses high-enrollment delay students enrolled in was also increased at around 17%, similar to the semester workload. When several leftover courses seem equally suboptimal for students, they might take on more than they can handle to avoid “missing out” on courses. This pattern of suboptimal decision-making aligns with meta-analytic evidence on the “choice overload effect.” The choice overload effect predicts that suboptimal decisions are caused by an abundance of choice and time pressure, for example, having several potential courses to choose from with limited time due to enrollment delay (Chernev et al., 2015). This overload could also be explained by a desire of students to maximize credit hours while minimizing workload found in a recent experiment (Borchers and Pardos, view). Specifically, when students are willing to take on additional workloads to earn credit, they might overload their courses and subsequently drop high-workload courses, as observed in this study, as they promise less credit per amount of work. To ease course selection in such cases, academic advising and course recommender systems (Pardos et al., 2019) could actively try to assess student preparedness for their chosen course load, hedge against adding more courses than necessary, and provide more information on courses during high uncertainty, delayed decision-making.
One related open research question the field could pursue in the future is how to best persuade students delaying their academic planning not to over-enroll, especially after assessing lacking academic preparedness and uncertainty in course choice. Aligning with students’ goals would be one path forward, as late-dropping and inadvertently over-enrolling are certainly not students’ intentions. To address this, how can we persuade students to adopt better planning behaviors through virtual recommender systems, academic advising, or a hybrid approach? Insights from human-computer interaction research on course recommender systems could provide insights into this issue (Méndez et al., 2023).
Further, students preferentially late dropped courses with comparatively high workloads at above-chance levels. Students also most commonly late-dropped the second highest workload course. One potential reason for students sticking to the highest workload course could be that those are more commonly required courses or courses in a prerequisite sequence, as prerequisites positively correlate with predicted workload (Borchers and Pardos, 2023). An alternative explanation is that late-dropping an easy course weighs heavier for a student, so they conserve resources to complete as many courses as possible. According to that explanation, high-enrollment delay students who late-dropped more would exhibit more loss aversion (Boyce et al., 2016) and try to retain more courses, for which there was some evidence: they enrolled in more courses and also retained more course workload. In all cases, the finding that students preferentially dropped courses with higher workloads can be seen as an additional external validation of the employed course workload predictions of the present study, which were trained on student workload perceptions of courses (Borchers and Pardos, 2023).
5.4. Support for the Hypothesis of Enrollment Delay Causing Late Course Drops
RQ4 focuses on the empirical support from observational data of different causal hypotheses related to the relationship between enrollment delay and late course drops. To answer RQ4, we employed cross-lagged panel modeling for observational data (see Section 3.4.4). Our novel data set of timestamped course add and drop transactions during academic planning provided an ideal foundation for applying this modeling method from the adjacent field of educational psychology due to its longitudinal structure and scale, including multiple observations to capture temporal, concurrent semester measurements.
Applying cross-lagged panel modeling to our novel transaction data set, we gathered empirical evidence for a causal hypothesis between enrollment delay and subsequent late drops to be largely robust across students, regardless of their semester of enrollment or their effective workload entering the late add-drop period. The association between enrollment delay and late drops can be interpreted as evidence for a causal hypothesis due to several factors: (a) adjustment for outcome autocorrelation, (b) testing the alternative causal path to confirm the unidirectionality of the association, and (c) the time-lagged design of the models. Specifically, our modeling procedure satisfies the following criteria for causality from observational data (Cox Jr, 2018): temporal precedence, mutual information (i.e., a test of association strength), internal consistency (i.e., association tests across different semester adjustment sets), and specificity of effects (i.e., testing and ruling out alternative pathways). However, internal consistency was not perfect, as we note that the effect of enrollment delay on late course drops was significantly higher for students with higher semester workloads (RQ5). This may be because higher workloads contribute to a lack of academic preparedness that makes late-dropping courses more likely. Other interpretations could be explored, particularly regarding the prerequisite types of courses that are more likely to be dropped, which warrants further analysis in future work.
Contrary to findings by Wäschle et al. (2014), we did not find a bidirectional, reinforcing association between enrollment delay (as one form of the delay completing academic tasks) and subsequent late course dropping and vice versa. There was no reinforcing association between late drops (i.e., low goal achievement) and enrollment delay in the next semester. There are multiple potential reasons why we only observed a unidirectional link. One reason could be the lengthy feedback interval between late dropping and subsequent enrollment delay, which was too distant to affect motivational outcomes such as self-efficacy, which is closely related to enrollment delay. Alternatively, late course drops may not be a good goal achievement proxy, as many factors beyond a student’s control may contribute to late drops, which may act to preserve a subjective sense of self-efficacy. For instance, financial necessities might compel students to take on part-time jobs, leading them to drop courses later in the term. Similar factors might partially explain differences in enrollment delay tendencies, although we expect those differences to even out when averaging differences in student-initiated enrollment actions at scale, as done in the present study. Relatedly, students in our sample might predominantly attribute late course drops to external factors (e.g., circumstances rather than innate ability), thus shielding themselves from self-efficacy losses that could reinforce enrollment delay (Gerace, 2020, Schunk, 2023). Future work could explore this further by monitoring self-efficacy and attribution styles through surveys.
While employing cross-lagged panel models, as in this study, allows for estimating the likelihood of causal statements about the relationship between two time-lagged variables (e.g., enrollment delay and subsequent late-dropping), it is important to note that enrollment delay is not the only causal factor that could have caused late dropping and that the mechanism of how enrollment delay causes late dropping is an open research question. First, regarding other factors underlying late drops, several have been identified in prior work, such as race, gender, age, preparedness, part-time enrollment, GPA, and course subject, among others (McKinney et al., 2019). While each of these factors could independently contribute to late dropping, it is also conceivable that they contribute to enrollment delay. Therefore, in future work, it is desirable to investigate who delays and when by jointly modeling enrollment delay alongside course and student attributes related to late dropping. This would further shed light on the second issue related to the specific mechanism of enrollment delay, which we discuss next.
While differences in procrastination between students pose one potential interpretation of our findings, such an interpretation ascribes agency to the student (i.e., it assumes the student willingly decides to procrastinate and would have had a choice not to). Equating enrollment delay and procrastination assumes that all students face equal or highly similar circumstances. However, in higher education, such an assumption is strong, and students encounter diverse life events—unique challenges and disruptions that do not affect everyone equally. Other academic considerations could also delay enrollment, for example, the state of requirement satisfaction of students might constrain the course choices students have and prompt them to decide on courses later, a hypothesis for future research (Stavrinides and Zuev, 2023). Similarly, if there are uncertainties about major declaration decisions, students might hold off on enrolling to reflect on their course preferences for longer. Some of these events cannot simply be categorized as procrastination. Nonetheless, as past work has noted that students who enroll late exhibit higher trait procrastination as assessed in surveys (De Paola and Scoppa, 2015, Reuben et al., 2015), there is likely at least some variation in enrollment timing explained by procrastination. Therefore, the negative relationship between enrollment delay and late dropping found in the present study merits future research to help students navigate factors of delayed enrollment that are in their control, perhaps through academic advisors who can identify diverse factors underlying student enrollment decisions. In that effort, procrastination could be an important lens to explain broader institutional trends in delayed academic planning across students. Further, we identified workload and the choice of difficult courses as a potential mechanism for why enrollment delay may cause late dropping in this study, as discussed in Section 5.3.
Motivating replications of the findings presented in the current study at other higher education institutions, we envision two potential augmentations to the analyses and data presented here to further understand the link between delayed enrollment and late course dropping. First, future work could explore enhancements to data collection, such as incorporating concurrent survey assessments of trait procrastination (Lay and Schouwenburg, 1993) or occasionally prompting or interviewing students about reasons for late course additions and drops. Second, student-level differences in potential external stressors or coping strategies with academic workload could be studied to understand external stressors impacting student behavior. This study could be especially relevant in populations where students more commonly take on part-time jobs or take care of children. For replication purposes, samples of a few hundred students across multiple semesters might be sufficient (Wäschle et al., 2014), subject to power analyses.
Another direction for research to bolster a causal interpretation of our results could be to investigate potential interventions to help students in academic planning. How could students be supported to combat enrollment delay and mitigate the costly and adverse effects of late dropping? Nascent human-computer interaction research has proposed promising designs in how large language models could help students mitigate academic procrastination, such as writing customized reminder emails to oneself (Bhattacharjee et al., 2024). As solutions to reduce procrastination in academic planning are rare or have not been documented in recent review articles (Zacks and Hen, 2018, Salguero-Pazos and Reyes-de Cózar, 2023), more research is needed to understand student needs for academic planning when enrollment delay occurs, such as more information on courses when course catalog information is perceived as insufficient (Scott and Savage, 2022). Co-design research to generate applications that help combat enrollment delay could involve academic advisors with experience in student course planning preferences, needs, and challenges. However, it is important to note that intervention aimed at avoiding delayed enrollment might not be enough to reduce late drops, as we found that it is not late adds that relate to higher workloads students with delayed enrollment take on; rather, it is that they generally take on higher workload courses, and more courses, potentially due to underlying traits and tendencies to overload on choice (Chernev et al., 2015) as discussed in Section 5.3. Hence, interventions could also involve regular assessments of planning quality, regular planning, and workload awareness. Future work might explore integrating workload analytics (Borchers and Pardos, 2023) into academic advising to support students in making more well-planned course decisions. An open question remains whether these analytics should aim to make students more aware of the workload of specific courses they take on, or of how much they can take on based on historical data, or both.
6. Limitations and Future Work
We see three limitations to the present study that guide future work. First, the present study’s findings were constrained to one higher education institution. Future work could develop a standardized taxonomy and way of analyzing course transactions in relationship to add-drop and late add-drop deadlines to create predictive modelings of academic outcomes that generalize across institutions. Second, the present study has looked at late drops as one form of student academic outcomes. However, transaction data and the features present in the present study could be used to model other, more distal academic outcomes, such as GPA and on-time graduation. In line with the prior work on predicting student outcomes in EDM (Jiang et al., 2019), our features could be used in recommender systems or forecast models that support higher education students. However, we highlight the merit of straightforward linear regression models used in this study for retaining linear interpretations of associations between enrollment delay and late drops and leave the study of non-linear interaction modeling of enrollment outcomes from transaction data to future work. Third, the present study has investigated adds and drops as features representing student course transaction activity. Still, future work can gain insight into student course selection by looking into more diverse and fine-grain features mined from these records. For example, course swaps between courses with relatively high and low workloads or substituting a required course for an elective course could have distinct signals for student outcomes, including late drops. In-depth studies of class availability, course quotas, and popularity could reveal further insights into students’ course enrollment strategies and mismanagement during academic planning. Fourth, while we found no evidence that students’ semester of enrollment (e.g., first-year compared to third-year students) moderates the effect of delayed enrollment on late course dropping, other moderators related to academic attributes of students may exist, such as their major, as majors may exhibit distinct enrollment patterns. While our data set did not include the student’s major, future work may investigate such diversity at higher education institutions where majors considerably differ in their course selection degrees of freedom.
7. Conclusion
The present study investigated how records of student academic planning encoded in timestamped add-and-drop transaction data can explain student course selection mismanagement represented in late drops. Documenting students’ general course planning patterns, we found 25-50% of course enrollment activity to happen during the first 5-10 weeks comprising the Phase 1 enrollment period. Further, we found that students who enrolled in courses late were likelier to drop classes late. Enrollment delay (17%) and late-dropping (10%) were associated with a general tendency of late-dropping students to enroll in higher workloads rather than being forced to take on high-workload courses at the end of the academic planning period. This additional workload comes at a cost as these students were more likely to drop high-workload courses late, indicating a lack of preparedness for the additional workload they take on when delaying enrollment. Applying cross-lagged panel modeling as a novel methodological lens on large-scale enrollment histories, we gathered empirical support for the hypothesis that the observed relationship between enrollment delay and late-dropping is causal and more pronounced in students taking on higher semester workloads. Taken together, these findings suggest that interventions targeting enrollment delay, encouraging regular planning, discouraging overloading, and preparing for high workloads could help lower the frequency of adverse late drops in higher education. Such academic planning support can be delivered through course recommender systems, which help students plan earlier and select more appropriate course sets. Overall, transaction data offer various avenues for educational data mining to study the process through which students arrive at course sets during their academic semester that are more or less suited for them, opening the door for prediction, intervention, and collaboration with educational practitioners and policymakers seeking to enhance student success and retention in academic settings.
References
- Baker, R., Xu, D., Park, J., Yu, R., Li, Q., Cung, B., Fischer, C., Rodriguez, F., Warschauer, M., and Smyth, P. 2020. The benefits and caveats of using clickstream data to understand student self-regulatory behaviors: opening the black box of learning processes. International Journal of Educational Technology in Higher Education 17, 1–24.
- Bhattacharjee, A., Zeng, Y., Xu, S. Y., Kulzhabayeva, D., Ma, M., Kornfield, R., Ahmed, S. I., Mariakakis, A., Czerwinski, M. P., Kuzminykh, A., et al. 2024. Understanding the role of large language models in personalizing and scaffolding strategies to combat academic procrastination. In Proceedings of the CHI Conference on Human Factors in Computing Systems. 1–18.
- Borchers, C. and Pardos, Z. A. 2023. Insights into undergraduate pathways using course load analytics. In LAK23: 13th International Learning Analytics and Knowledge Conference. 219–229.
- Borchers, C. and Pardos, Z. A. under review. Course load analytics interventions on higher education course selection: Experimental evidence. Manuscript under review in Journal of Learning Analytics.
- Borchers, C., Xu, Y., and Pardos, Z. A. 2024. Are you an early dropper or late shopper? Mining enrollment transaction data to study procrastination in higher education. In Proceedings of the 17th International Conference on Educational Data Mining, B. Paaßen and C. D. Epp, Eds. International Educational Data Mining Society, Atlanta, Georgia, USA, 426–433.
- Botelho, A. F., Closser, A. H., Sales, A. C., Heffernan, N. T., and Vanacore, K. P. 2024. Causal inference in educational data mining.
- Boyce, C. J., Wood, A. M., and Ferguson, E. 2016. Individual differences in loss aversion: Conscientiousness predicts how life satisfaction responds to losses versus gains in income. Personality and Social Psychology Bulletin 42, 4, 471–484.
- Bryk, A. S. and Raudenbush, S. W. 1992. Hierarchical Linear Models: Applications and Data Analysis Methods. Sage Publications, Inc.
- Chaturapruek, S., Dee, T. S., Johari, R., Kizilcec, R. F., and Stevens, M. L. 2018. How a data-driven course planning tool affects college students’ GPA: evidence from two field experiments. In Proceedings of the Fifth Annual ACM Conference on Learning at Scale. 1–10.
- Chernev, A., Böckenholt, U., and Goodman, J. 2015. Choice overload: A conceptual review and meta-analysis. Journal of Consumer Psychology 25, 2, 333–358.
- Cormack, S. H., Eagle, L. A., and Davies, M. S. 2020. A large-scale test of the relationship between procrastination and performance using learning analytics. Assessment & Evaluation in Higher Education 45, 7, 1046–1059.
- Cox Jr, L. A. 2018. Modernizing the Bradford Hill criteria for assessing causal relationships in observational data. Critical Reviews in Toxicology 48, 8, 682–712.
- De Paola, M. and Scoppa, V. 2015. Procrastination, academic success and the effectiveness of a remedial program. Journal of Economic Behavior & Organization 115, 217–236.
- Duckworth, A. L., Tsukayama, E., and May, H. 2010. Establishing causality using longitudinal hierarchical linear modeling: An illustration predicting achievement from self-control. Social Psychological and Personality Science 1, 4, 311–317.
- Fellner, G. and Sutter, M. 2009. Causes, consequences, and cures of myopic loss aversion–an experimental investigation. The Economic Journal 119, 537, 900–916.
- Fischer, C., Pardos, Z. A., Baker, R. S., Williams, J. J., Smyth, P., Yu, R., Slater, S., Baker, R., and Warschauer, M. 2020. Mining big data in education: Affordances and challenges. Review of Research in Education 44, 1, 130–160.
- Gal, D. and Rucker, D. D. 2018. The loss of loss aversion: Will it loom larger than its gain? Journal of Consumer Psychology 28, 3, 497–516.
- Gerace, A. 2020. Internal and external attributions. In Encyclopedia of Personality and Individual Differences, V. Zeigler-Hill and T. K. Shackelford, Eds. Springer International Publishing, Cham, 2328–2334.
- Hagedorn, L. S., Maxwell, W. E., Cypers, S., Moon, H. S., and Lester, J. 2007. Course shopping in urban community colleges: An analysis of student drop and add activities. The Journal of Higher Education 78, 4, 464–485.
- Hamaker, E. L., Kuiper, R. M., and Grasman, R. P. 2015. A critique of the cross-lagged panel model. Psychological Methods 20, 1, 102.
- Hen, M. and Goroshit, M. 2014. Academic self-efficacy, emotional intelligence, GPA and academic procrastination in higher education. Eurasian Journal of Social Sciences 2, 1, 1–10.
- Huntington-Klein, N. and Gill, A. 2021. Semester course load and student performance. Research in Higher Education 62, 5, 623–650.
- Ilies, R., Dimotakis, N., and De Pater, I. E. 2010. Psychological and physiological reactions to high workloads: Implications for well-being. Personnel Psychology 63, 2, 407–436.
- Jiang, W. and Pardos, Z. A. 2020. Evaluating sources of course information and models of representation on a variety of institutional prediction tasks. Proceedings of the 13th International Conference on Educational Data Mining (EDM), 115–125.
- Jiang, W., Pardos, Z. A., and Wei, Q. 2019. Goal-based course recommendation. In Proceedings of the 9th International Conference on Learning Analytics & Knowledge. 36–45.
- Karimi-Haghighi, M., Castillo, C., and Hernández-Leo, D. 2022. A causal inference study on the effects of first year workload on the dropout rate of undergraduates. In International Conference on Artificial Intelligence in Education. Springer, 15–27.
- Kim, K. R. and Seo, E. H. 2015. The relationship between procrastination and academic performance: A meta-analysis. Personality and Individual Differences 82, 26–33.
- Lay, C. H. and Schouwenburg, H. C. 1993. Trait procrastination, time management. Journal of Social Behavior and Personality 8, 4, 647–662.
- Lenchner, E. 2017. Mining Transactional Student-Level Data to Predict Community College Student Outcomes. Columbia University.
- Li, J., Chai, L., Nordstrom, O., Tangpong, C., and Hung, K.-T. 2021. Development of a loss aversion scale. Journal of Managerial Issues 33, 1.
- Lippke, S., Pomp, S., and Fleig, L. 2018. Rehabilitants’ conscientiousness as a moderator of the intention–planning-behavior chain. Rehabilitation Psychology 63, 3, 460.
- Mackinnon, S. P. 2012. Perceived social support and academic achievement: Cross-lagged panel and bivariate growth curve analyses. Journal of Youth and Adolescence 41, 474–485.
- McKinney, L., Novak, H., Hagedorn, L. S., and Luna-Torres, M. 2019. Giving up on a course: An analysis of course dropping behaviors among community college students. Research in Higher Education 60, 184–202.
- Méndez, G. G., Galárraga, L., Chiluiza, K., and Mendoza, P. 2023. Impressions and strategies of academic advisors when using a grade prediction tool during term planning. In Proceedings of the 2023 CHI Conference on Human Factors in Computing Systems. 1–18.
- Mulder, J. D. and Hamaker, E. L. 2021. Three extensions of the random intercept cross-lagged panel model. Structural Equation Modeling: A Multidisciplinary Journal 28, 4, 638–648.
- Paas, F., Van Gog, T., and Sweller, J. 2010. Cognitive load theory: New conceptualizations, specifications, and integrated research perspectives. Educational Psychology Review 22, 2, 115–121.
- Pardos, Z. A., Borchers, C., and Yu, R. 2023. Credit hours is not enough: Explaining undergraduate perceptions of course workload using lms records. The Internet and Higher Education 56, 100882.
- Pardos, Z. A., Fan, Z., and Jiang, W. 2019. Connectionist recommendation in the wild: on the utility and scrutability of neural networks for personalized course guidance. User Modeling and User-adapted Interaction 29, 487–525.
- Pardos, Z. A. and Nam, A. J. H. 2020. A university map of course knowledge. PloS one 15, 9, e0233207.
- R Core Team. 2024. R: A Language and Environment for Statistical Computing. R Foundation for Statistical Computing, Vienna, Austria.
- Reid, G. B. and Nygren, T. E. 1988. The subjective workload assessment technique: A scaling procedure for measuring mental workload. In Advances in Psychology. Vol. 52. Elsevier, 185–218.
- Reuben, E., Sapienza, P., and Zingales, L. 2015. Procrastination and impatience. Journal of Behavioral and Experimental Economics 58, 63–76.
- Rosseel, Y. 2012. lavaan: An R package for structural equation modeling. Journal of Statistical Software 48, 1–36.
- Sabnis, S., Yu, R., and Kizilcec, R. F. 2022. Large-scale student data reveal sociodemographic gaps in procrastination behavior. In Proceedings of the Ninth ACM Conference on Learning@ Scale. 133–141.
- Salazar-Fernandez, J. P., Sepúlveda, M., Munoz-Gama, J., and Nussbaum, M. 2021. Curricular analytics to characterize educational trajectories in high-failure rate courses that lead to late dropout. Applied Sciences 11, 4, 1436.
- Salguero-Pazos, M. R. and Reyes-de Cózar, S. 2023. Interventions to reduce academic procrastination: A systematic review. International Journal of Educational Research 121, 102228.
- Schouwenburg, H. C. 2004. Academic procrastination: Theoretical notions, measurement, and research. In Counseling the Procrastinator in Academic Settings, H. C. Schouwenburg, C. H. Lay, T. A. Pychyl, and J. R. Ferrari, Eds. American Psychological Association, Washington, DC, 3–17.
- Schunk, D. H. 2023. Self-regulation of self-efficacy and attributions in academic settings. In Self-regulation of Learning and Performance. Routledge, 75–99.
- Schwarz, G. 1978. Estimating the dimension of a model. The Annals of Statistics 6, 2, 461–464.
- Scott, M. and Savage, D. A. 2022. Lemons in the university: Asymmetric information, academic shopping and subject selection. Higher Education Research & Development 41, 4, 1247–1261.
- Scully, G. and Kerr, R. 2014. Student workload and assessment: Strategies to manage expectations and inform curriculum development. Accounting Education 23, 5, 443–466.
- Seabold, S. and Perktold, J. 2010. Statsmodels: Econometric and Statistical Modeling with Python. In Proceedings of the 9th Python in Science Conference, Stéfan van der Walt and Jarrod Millman, Eds. 92 – 96.
- Selig, J. P. and Little, T. D. 2012. Autoregressive and cross-lagged panel analysis for longitudinal data. In Handbook of Developmental Research Methods, B. Laursen, T. D. Little, and N. A. Card, Eds. The Guilford Press, 265–278.
- Shao, E., Guo, S., and Pardos, Z. A. 2021. Degree planning with plan-bert: Multi-semester recommendation using future courses of interest. In Proceedings of the AAAI Conference on Artificial Intelligence. Vol. 35. 14920–14929.
- Shedd, J. M. 2003. The history of the student credit hour. New Directions for Higher Education 2003, 122, 5–12.
- Smith, A. P. 2019. Student workload, wellbeing and academic attainment. In International Symposium on Human Mental Workload: Models and Applications. Springer, 35–47.
- Stavrinides, P. and Zuev, K. M. 2023. Course-prerequisite networks for analyzing and understanding academic curricula. Applied Network Science 8, 1, 19.
- Steel, P. 2007. The nature of procrastination: A meta-analytic and theoretical review of quintessential self-regulatory failure. Psychological Bulletin 133, 1, 65.
- Wang, X., Yu, X., Guo, L., Liu, F., and Xu, L. 2020. Student performance prediction with short-term sequential campus behaviors. Information 11, 4, 201.
- Wäschle, K., Allgaier, A., Lachner, A., Fink, S., and Nückles, M. 2014. Procrastination and self-efficacy: Tracing vicious and virtuous circles in self-regulated learning. Learning and Instruction 29, 103–114.
- Xu, Y. and Pardos, Z. A. 2023. Mining detailed course transaction records for semantic information. In Proceedings of the 16th International Conference on Educational Data Mining, M. Feng, T. Käser, and P. Talukdar, Eds. International Educational Data Mining Society, Bengaluru, India, 388–395.
- You, J. W. 2015. Examining the effect of academic procrastination on achievement using LMS data in e-learning. Journal of Educational Technology & Society 18, 3, 64–74.
- Zacks, S. and Hen, M. 2018. Academic interventions for academic procrastination: A review of the literature. Journal of Prevention & Intervention in the Community 46, 2, 117–130.